
Building a multi-agent system for drug target discovery
I built a multi-agent system in plain python that takes a disease name and autonomously finds potential drug targets by querying public bioinformatics databases. You enter “Alzheimer disease” as an input and returns a ranked list of targets, each annotated with protein structure data, known compounds, clinical trial progress, and recent literature. I ran it on three diseases and the results matched real-world pharma consensus in every case, without any hardcoded domain knowledge. ...

Classifying brain regions from gene expression RNA-seq data
tl;dr I trained three classifiers (Logistic Regression, Random Forest, XGBoost) to predict brain region of origin from GTEx bulk RNA-seq expression profiles across 13 brain regions and 2,642 samples. XGBoost did best: 95.1% accuracy (5-fold CV: 94.9 +/- 0.9%), macro-averaged AUROC near 0.99. Cerebellum and spinal cord were classified perfectly (F1 = 1.00). Basal ganglia subregions (caudate, putamen, nucleus accumbens) were hardest to separate (F1 ~ 0.89-0.96), which makes sense given their shared developmental origin. The top discriminative genes are not statistical artefacts. They map onto known neurobiology: RORB (#2, cortical layer IV marker), GAL and TRH (#9 and #19, hypothalamic neuropeptides), and a cluster of cerebellar-specific genes (ARHGEF33, HR, KCNJ6) all appear near the top. Non-coding RNAs (lncRNAs + pseudogenes) make up ~37% of the top 30 features. The brain has the highest proportion of non-coding transcription of any organ, so this isn’t surprising. Disclaimer: This was a hobby project. I tried to be rigorous, but these results are an initial exploration, not an exhaustive analysis. The pseudogene hits at the top of the ranking especially need validation to rule out mapping artefacts. ...

COVID-19 Germany local incidence and ICU occupancy (in German)
- Dashboard Heroku App - Twitter bot @corona7tage All data is based on the official APIs by RKI dashboard and DIVI

Graph Convolutional Networks for Fraud Detection of Bitcoin Transactions
tl;dr I trained 4 different types of models to classify bitcoin transactions. For each, two versions of the feature set were used: all features (local + neighborhood-aggregated) and only local features (without neighborhood information). The best model was a Random Forest trained with all features: its performance was impaired when the aggregated features were removed. The best graph-based neural network model was APPNP and its performance was better when only local features were used. APPNP performed better than an MLP with comparable complexity, indicating that the graph structure information gave it an advantage. Finally, the best GCN model required using all features and several strategies to reduce overfitting. The excellent performance of a Random Forest shows that it makes sense to consider simple models when faced with a new task. It also indicates that the individual node features in the Elliptic dataset are already informative enough to make good predictions. It would be interesting to explore how the model performs, when fewer samples and/or features are available for training. ...

Fitbit activity and sleep data: a time-series analysis with Generalized Additive Models
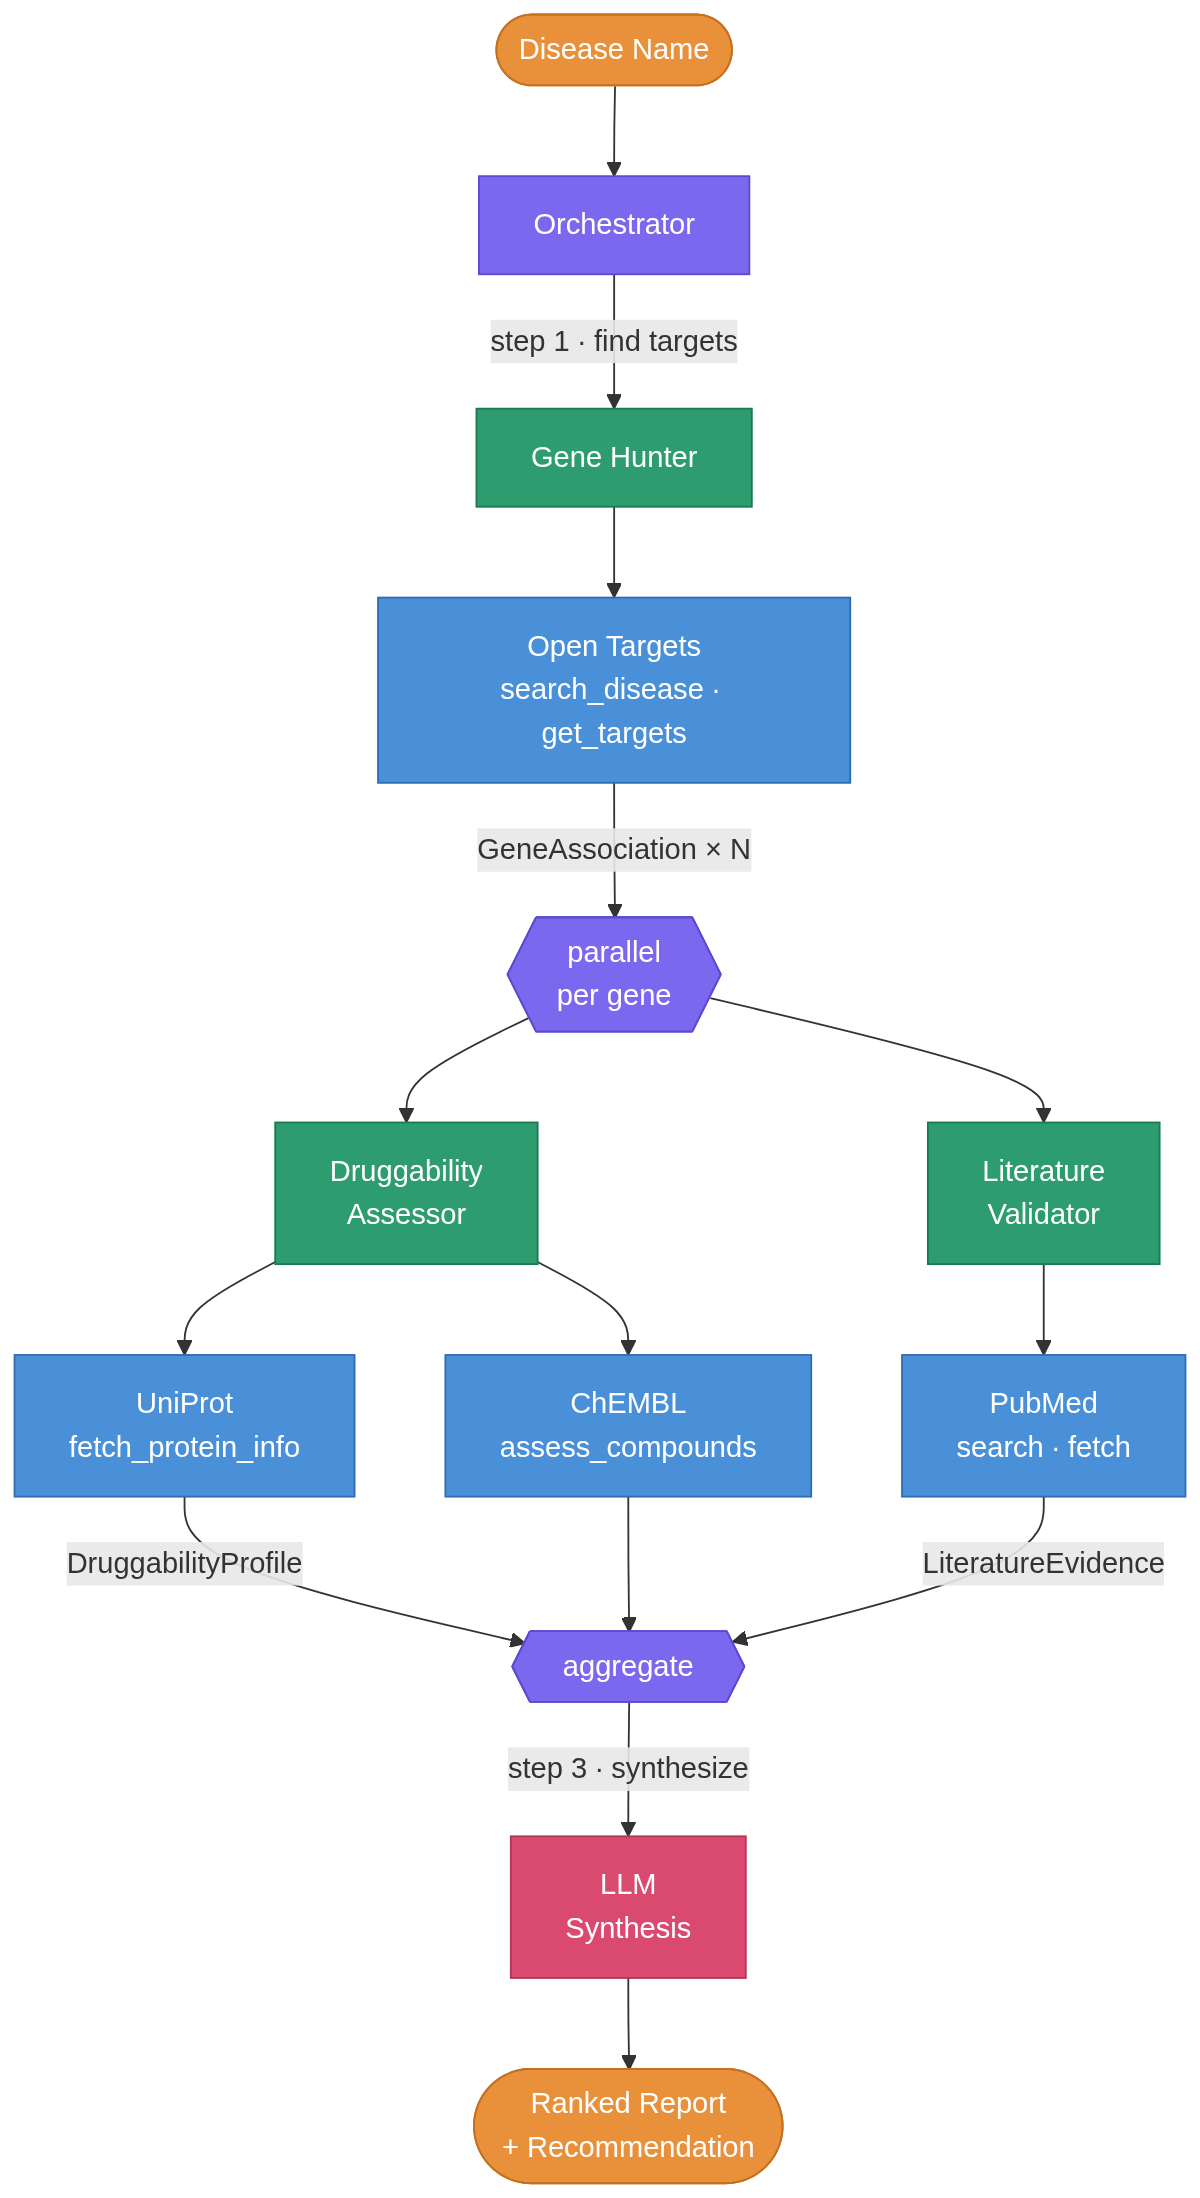
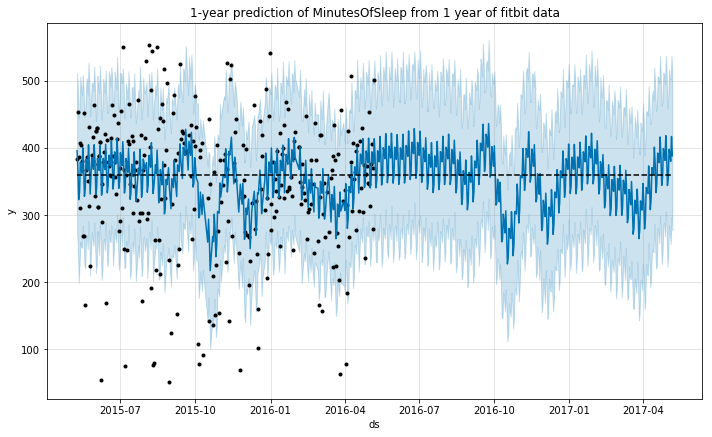
The goal of this notebook is to provide an analysis of the time-series data from a user of a fitbit tracker throughout a year. I will use this data to predict an additional year of the life of the user using Generalized Additive Models. Data source: Activity, Sleep Packages used: pandas, numpy, matplotlib, seaborn Prophet import pandas as pd import numpy as np from fbprophet import Prophet import matplotlib.pyplot as plt import seaborn as sns %matplotlib inline Data cleaning (missing data and outliers) # import the activity data activity = pd.read_csv('OneYearFitBitData.csv') # change commas to dots activity.iloc[:,1:] = activity.iloc[:,1:].applymap(lambda x: float(str(x).replace(',','.'))) # change column names to English activity.columns = ['Date', 'BurnedCalories', 'Steps', 'Distance', 'Floors', 'SedentaryMinutes', 'LightMinutes', 'ModerateMinutes', 'IntenseMinutes', 'IntenseActivityCalories'] # import the sleep data sleep = pd.read_csv('OneYearFitBitDataSleep.csv') # check the size of the dataframes activity.shape, sleep.shape # merge dataframes data = pd.merge(activity, sleep, how='outer', on='Date') # parse date into correct format data['Date'] = pd.to_datetime(data['Date'], format='%d-%m-%Y') # correct units for Calories and Steps for c in ['BurnedCalories', 'Steps', 'IntenseActivityCalories']: data[c] = data[c]*1000 Once imported, we should check for any missing data: ...

Personalized Medicine Kaggle Competition
This notebook describes my approach to the Kaggle competition named in the title. This was a research competition at Kaggle in cooperation with the Memorial Sloan Kettering Cancer Center (MSKCC). The goal of the competition was to create a machine learning algorithm that can classify genetic variations that are present in cancer cells. Tumors contain cells with many different abnormal mutations in their DNA: some of these mutations are the drivers of tumor growth, whereas others are neutral and considered passengers. Normally, mutations are manually classified into different categories after literature review by clinicians. The dataset made available for this competition contains mutations that have been manually anotated into 9 different categories. The goal is to predict the correct category of mutations in the test set. ...

Exploratory analysis of Medicare drug cost data 2011-2015
Health care systems world-wide are under pressure due to the high costs associated with disease. Now more than ever, particularly in developed countries, we have access to the latest advancements in medicine. This contrasts with the challenge of making those treatments available to as many patients as possible. It is imperative to find ways maximize the positive impact on the quality of life of patients, while maintaining a sustainable health care system. For this purpose I performed an analysis of Medicare data in the USA. Furthermore I used a drug-disease open database to cluster the costs by disease. I identified the most expensive diseases (mostly chronic diseases such as Diabetes) and the most expensive medicines. A drug for the treatment of HCV infections (Harvoni) stands out with the highest total costs in 2015. After this first exploration, I propose the in-depth analysis of further data to enable more targeted conclusions and recommendations to improve health care, such as linking of price databases to compare drug costs for the similar indications or the analysis of population data registers that document life style characteristics of healthy and sick individuals to identify those at risk of developing high-cost diseases. ...

Visualizing parallel event series in Python
Do movie releases produce literal earthquakes? We always hear about new movie releases being a “blast”, some sure are. But how do two independent events correlate with each other? In this post, I will use Python to visualize two different series of events, plotting them on top of each other to gain insights from time series data. # Imports from datetime import datetime import numpy as np import pandas as pd import matplotlib.pyplot as plt import seaborn as sns sns.set_palette('Set2') sns.set_style("whitegrid") %matplotlib inline Getting the data To make this example more fun, I decided to use two independent series of events for which data is readily available in the internet: ...

Simulating the revenue of a product with Monte-Carlo random walks
Being able to see the future would be a great superpower (or so one would think). Luckily, it is already possible to model the future using Python to gain insights into a number of problems from many different areas. In marketing, being able to model how successful a new product will be, would be of great use. In this post, I will take a look at how we can model the future revenue of a product by making certain assumptions and running a Monte Carlo Markov Chain simulation. ...