tl;dr
I trained three classifiers (Logistic Regression, Random Forest, XGBoost) to predict brain region of origin from GTEx bulk RNA-seq expression profiles across 13 brain regions and 2,642 samples.
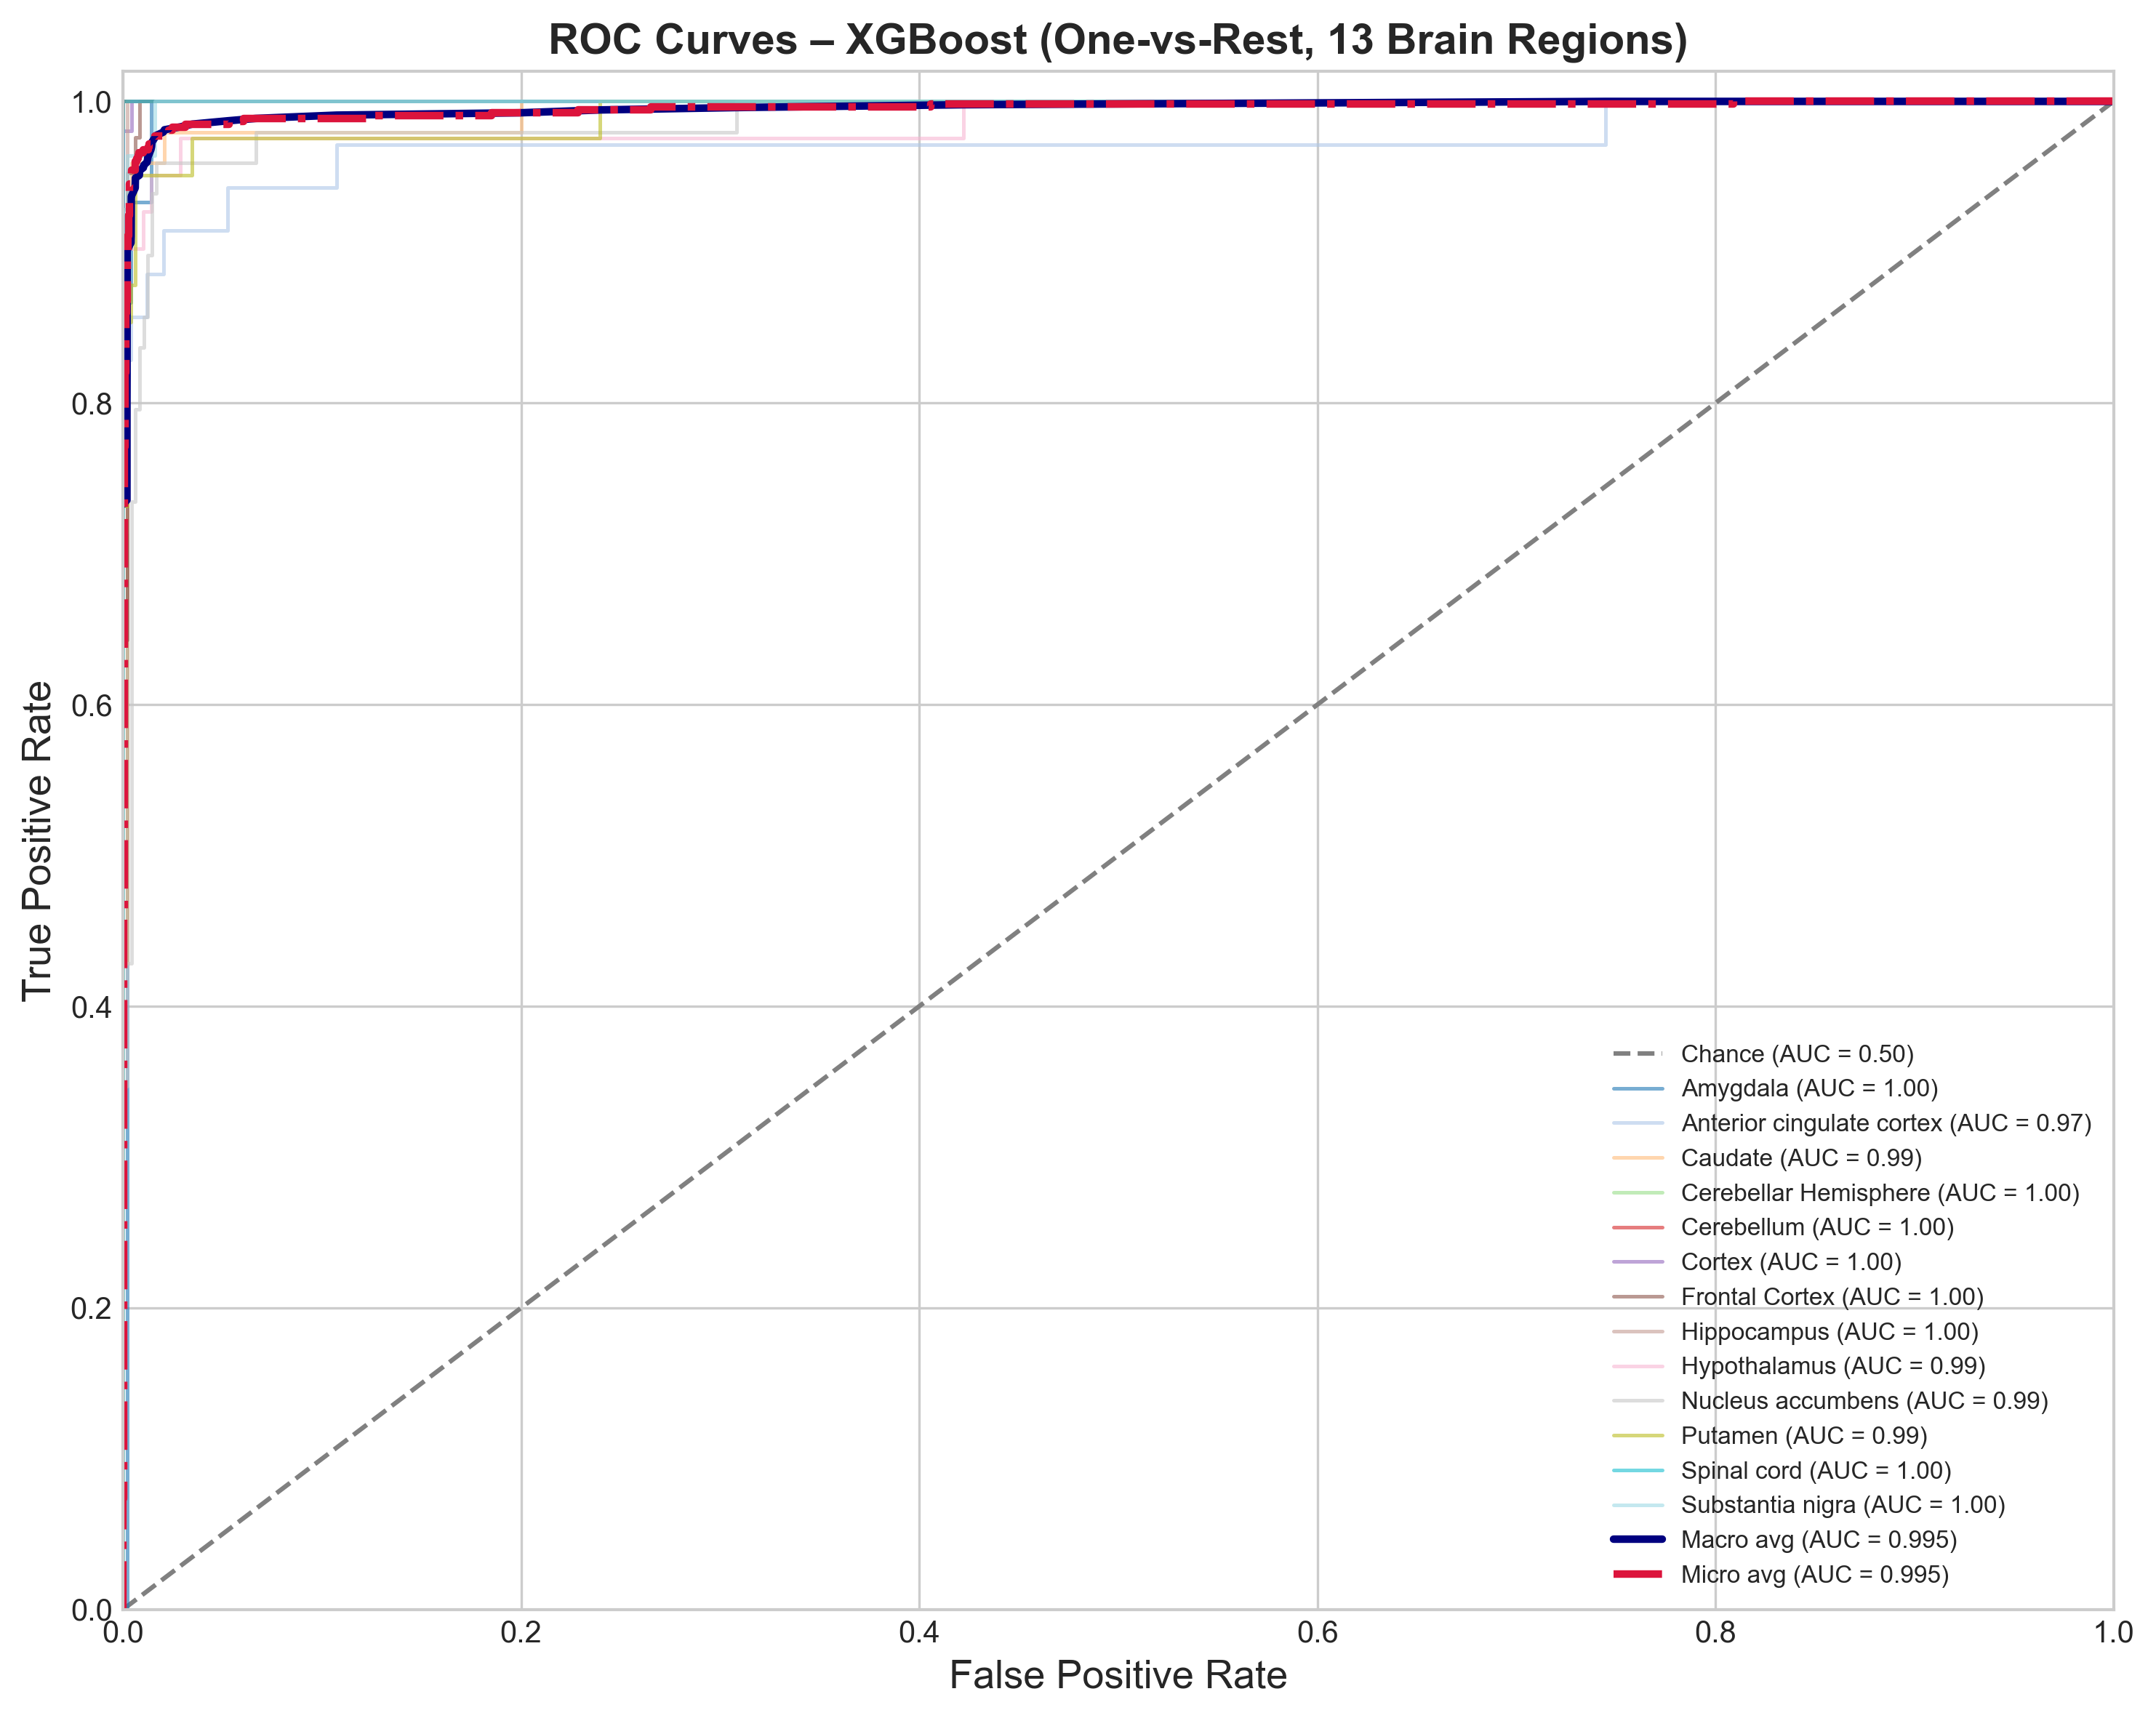
- XGBoost did best: 95.1% accuracy (5-fold CV: 94.9 +/- 0.9%), macro-averaged AUROC near 0.99.
- Cerebellum and spinal cord were classified perfectly (F1 = 1.00). Basal ganglia subregions (caudate, putamen, nucleus accumbens) were hardest to separate (F1 ~ 0.89-0.96), which makes sense given their shared developmental origin.
- The top discriminative genes are not statistical artefacts. They map onto known neurobiology: RORB (#2, cortical layer IV marker), GAL and TRH (#9 and #19, hypothalamic neuropeptides), and a cluster of cerebellar-specific genes (ARHGEF33, HR, KCNJ6) all appear near the top.
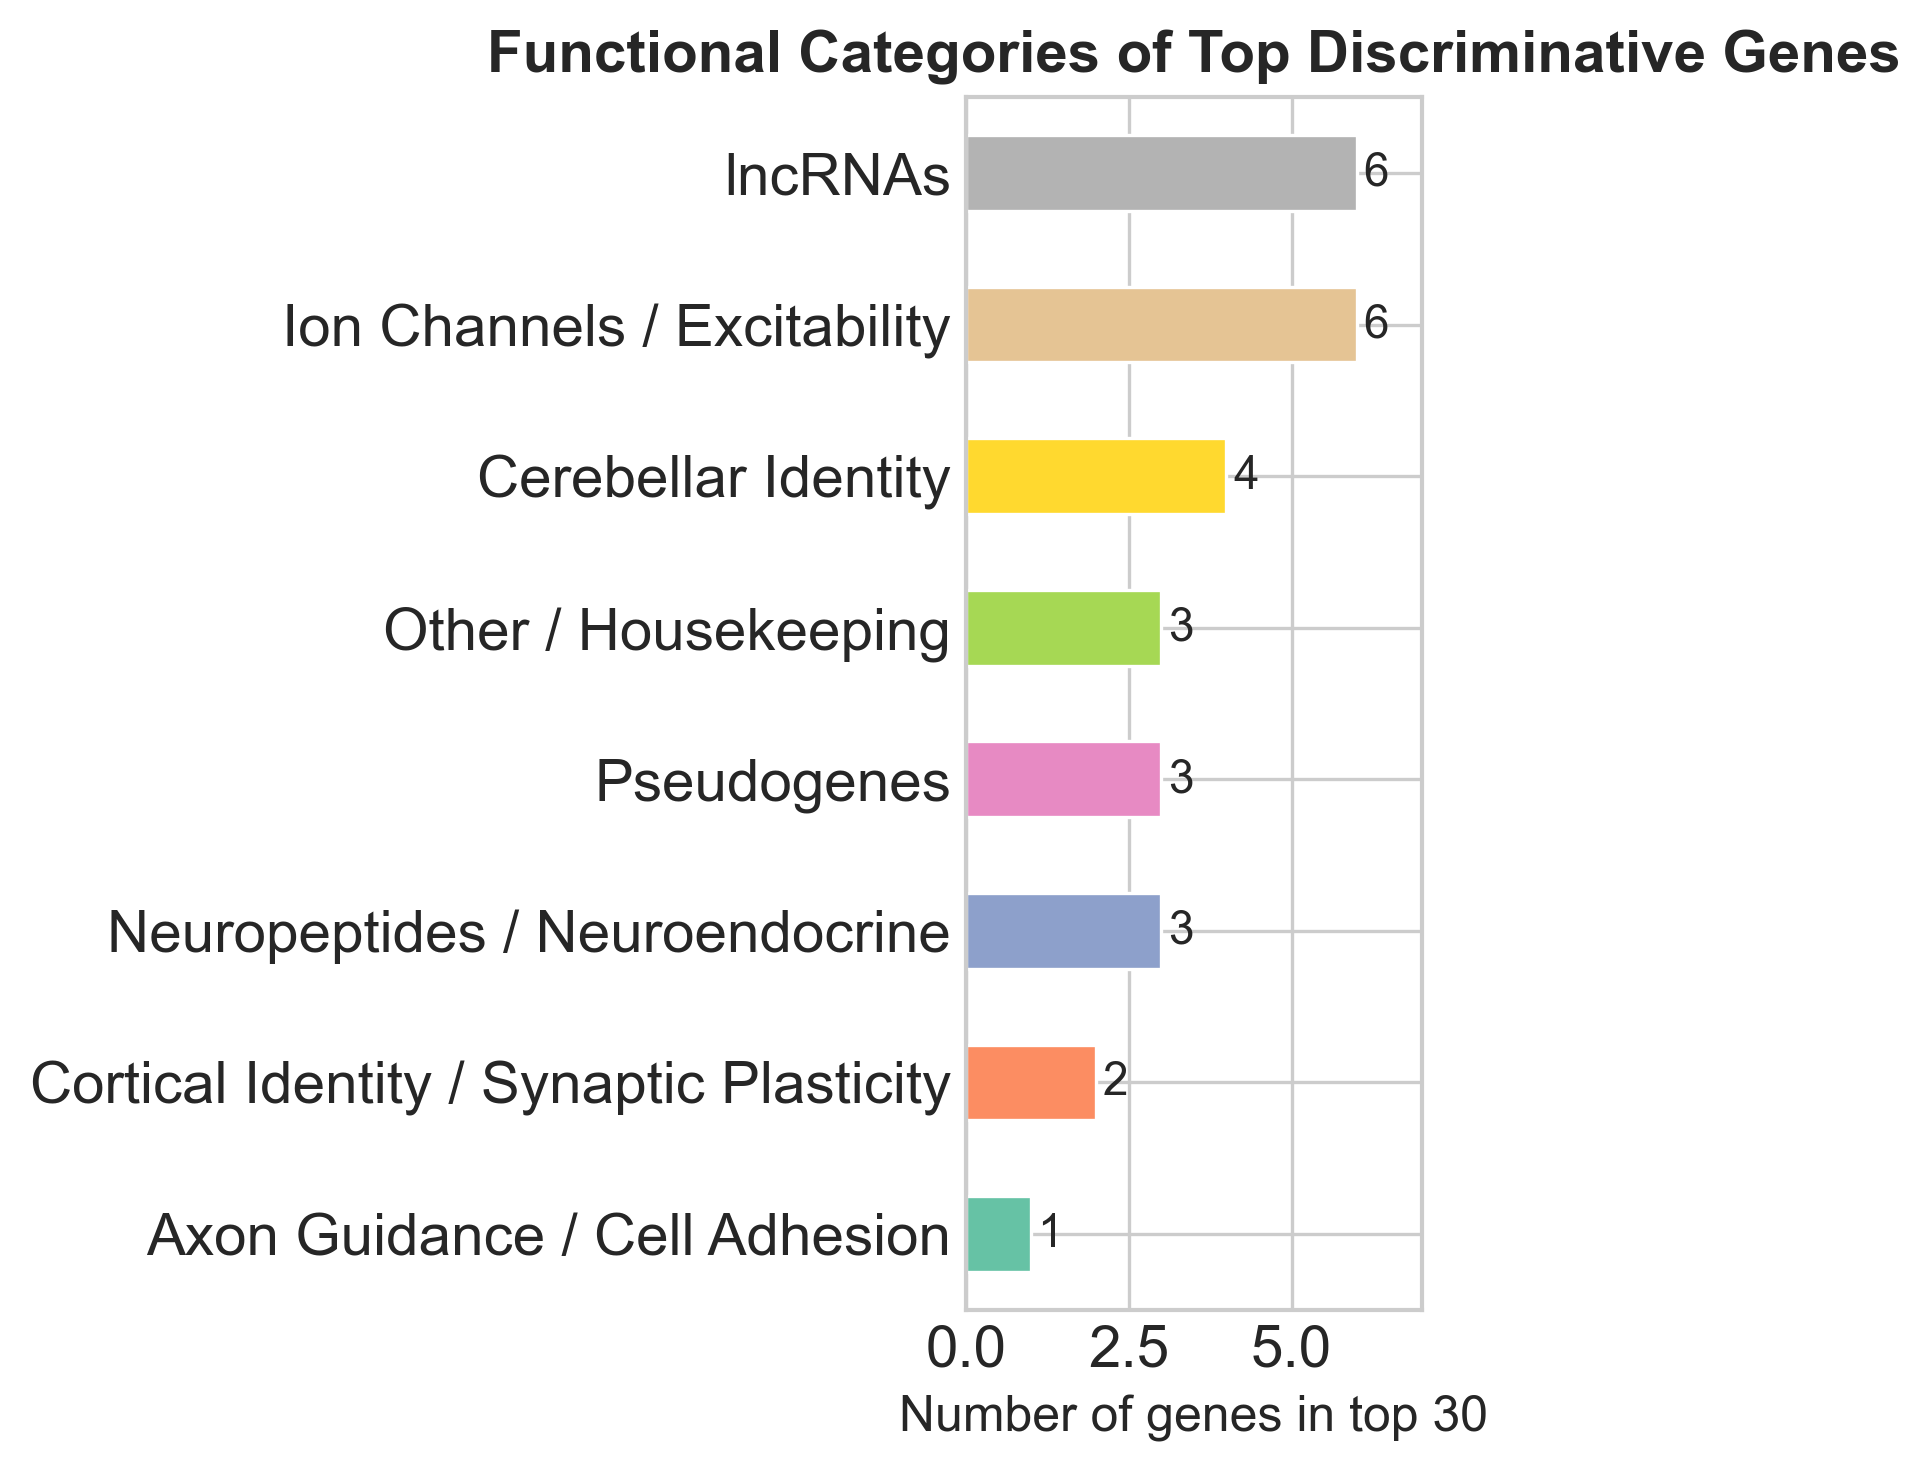
- Non-coding RNAs (lncRNAs + pseudogenes) make up ~37% of the top 30 features. The brain has the highest proportion of non-coding transcription of any organ, so this isn’t surprising.
Disclaimer: This was a hobby project. I tried to be rigorous, but these results are an initial exploration, not an exhaustive analysis. The pseudogene hits at the top of the ranking especially need validation to rule out mapping artefacts.
Introduction
The Genotype-Tissue Expression (GTEx) project provides bulk RNA-seq data across dozens of human tissues, including 13 brain regions. The question I wanted to answer: given a gene expression profile from an unknown brain sample, can we predict which region it came from?
The classification accuracy itself matters less to me than what the model learns. If it separates the hypothalamus using neuropeptide genes that neuroendocrinologists have studied for decades, that’s reassuring. If it relies on mapping artefacts or batch effects, that’s a problem.
Data
Expression data and sample metadata were downloaded from GTEx via the recount3 R/Bioconductor package. After filtering for brain samples and removing lowly-expressed genes (< 20% of samples), the final dataset:
| Samples | 2,642 |
| Genes | 18,731 |
| Brain regions | 13 |
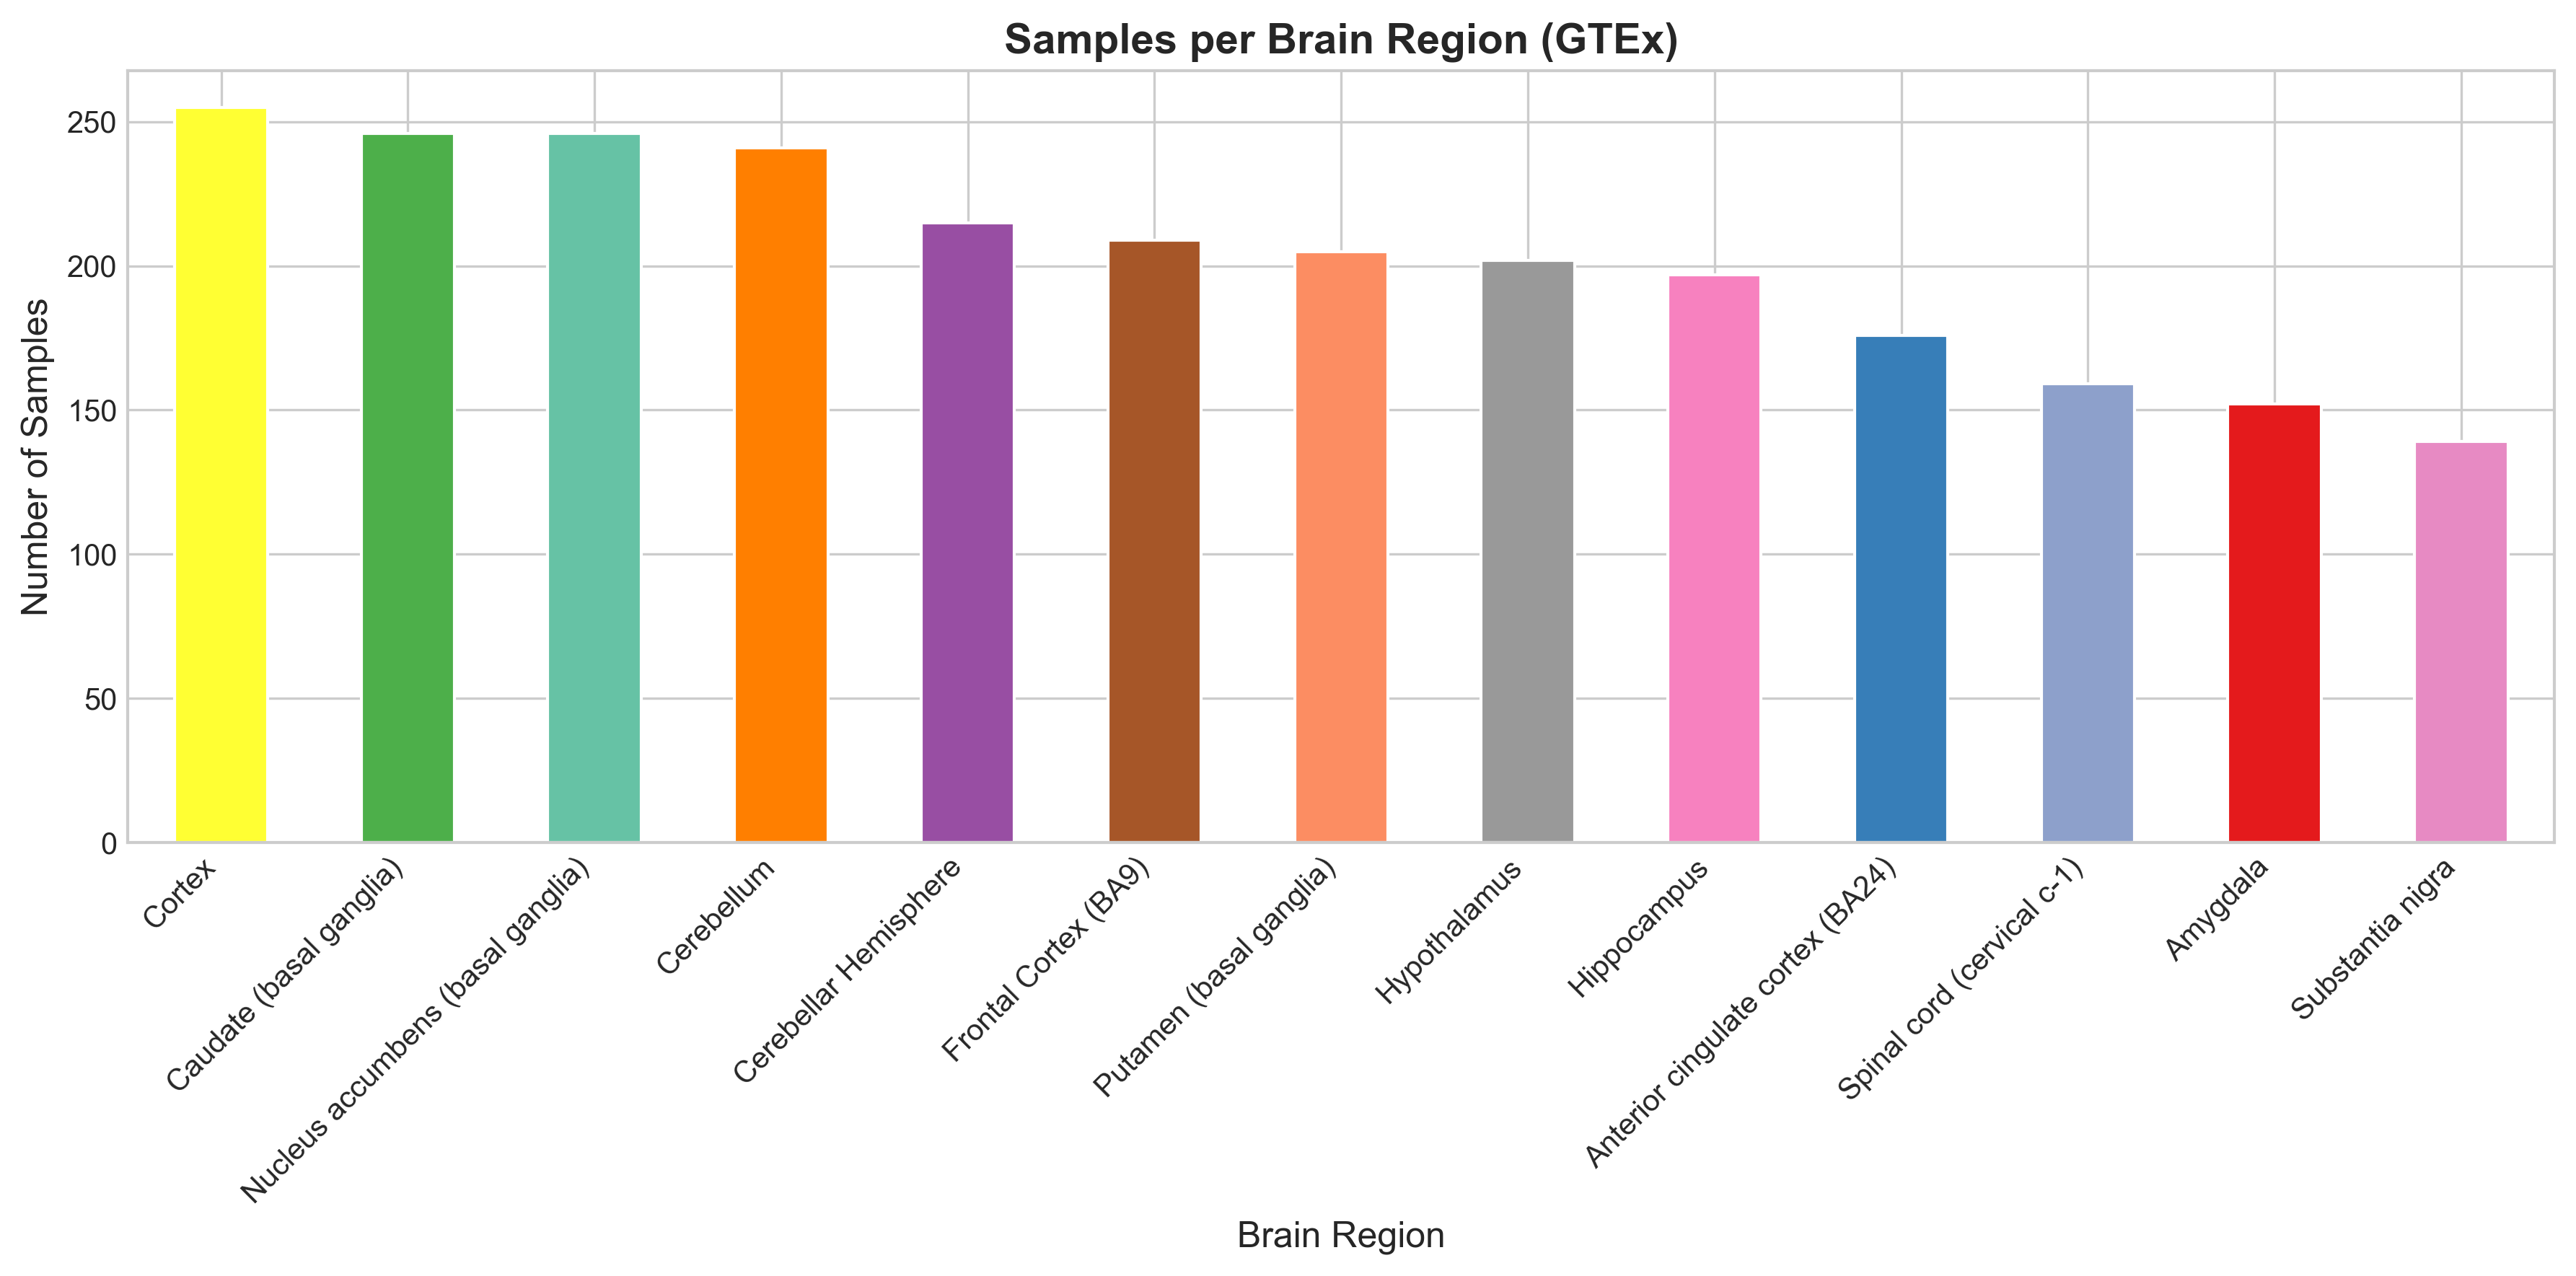
| Samples per region | 139 (substantia nigra) to 255 (cortex) |
Expression values are log2(TPM + 1).
Exploratory data analysis
PCA
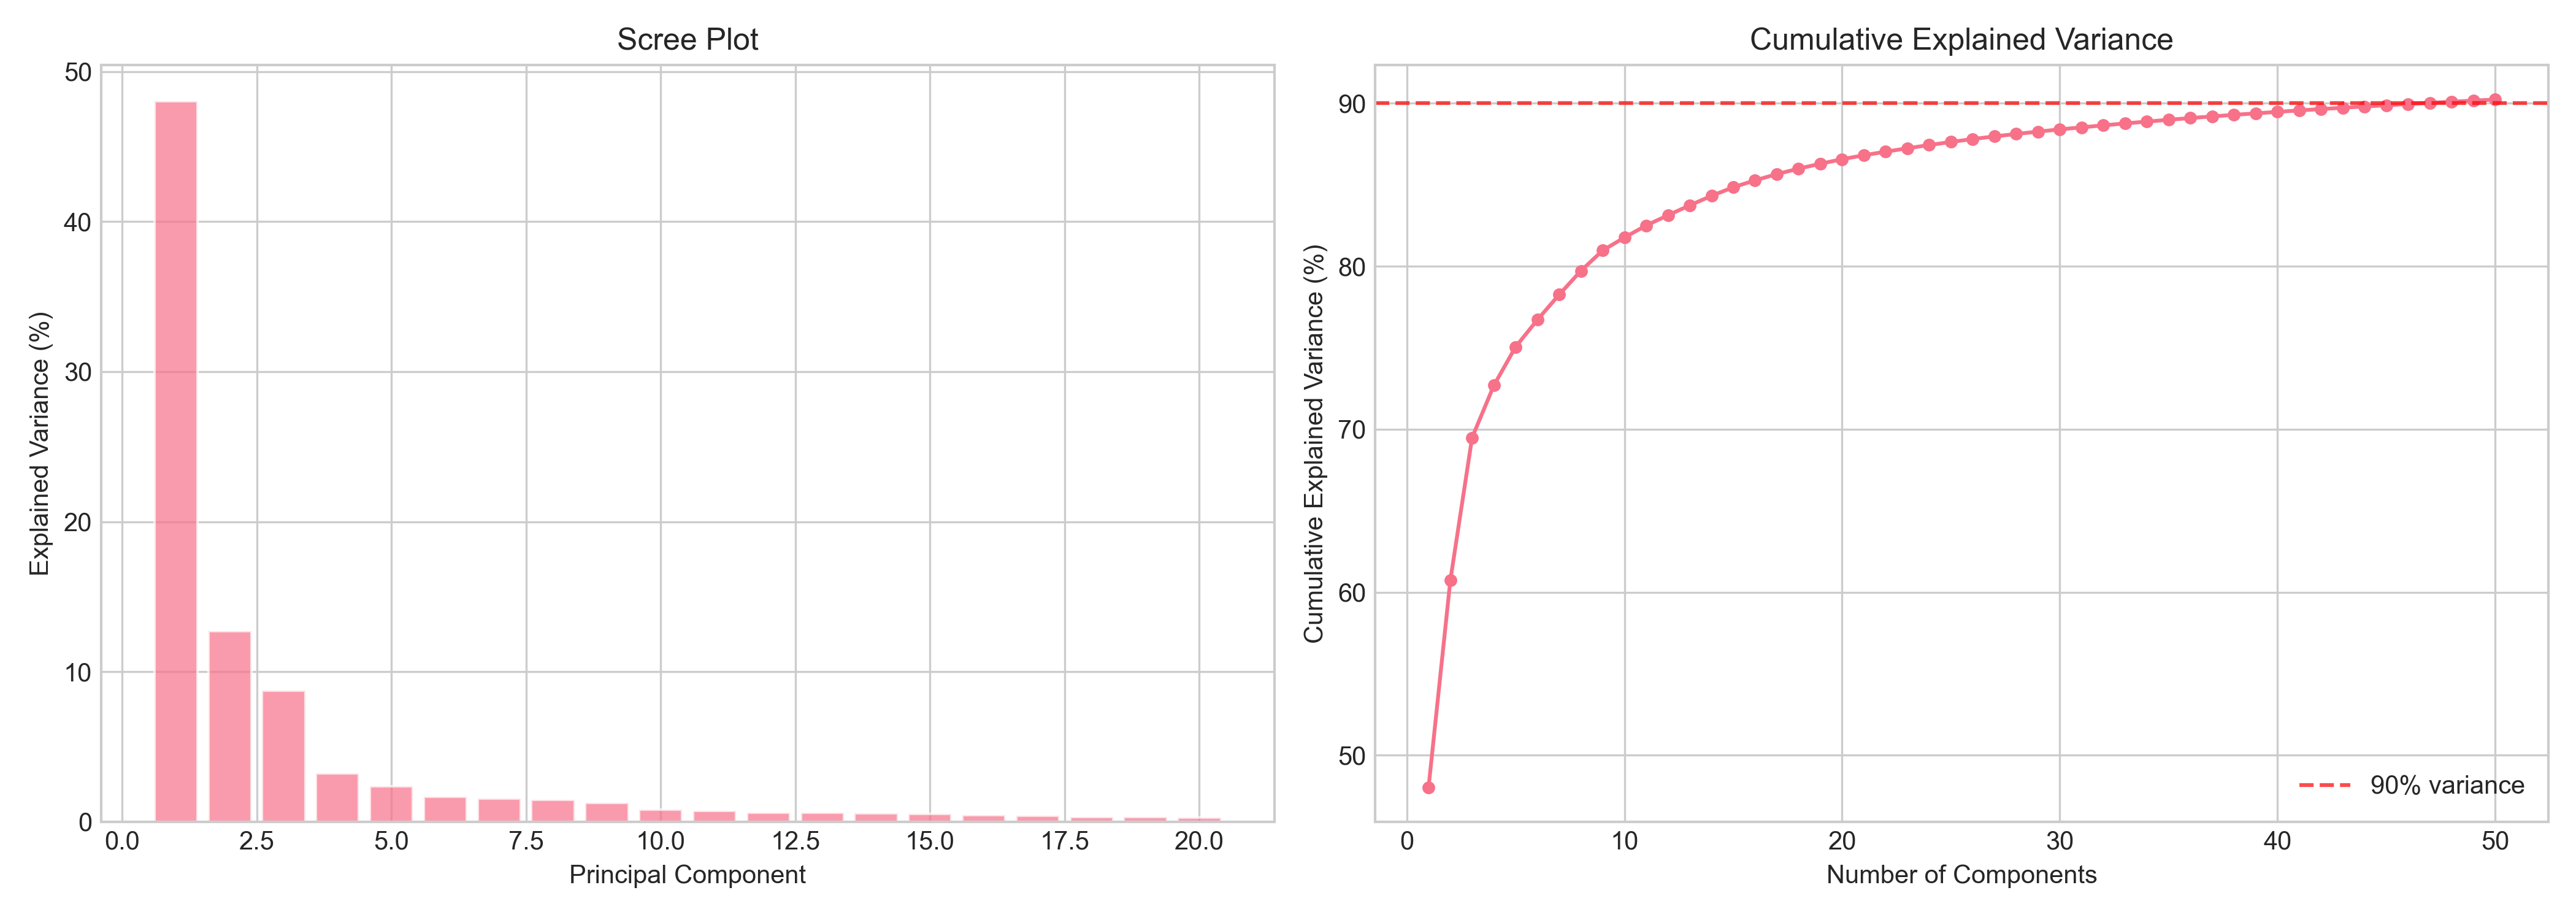
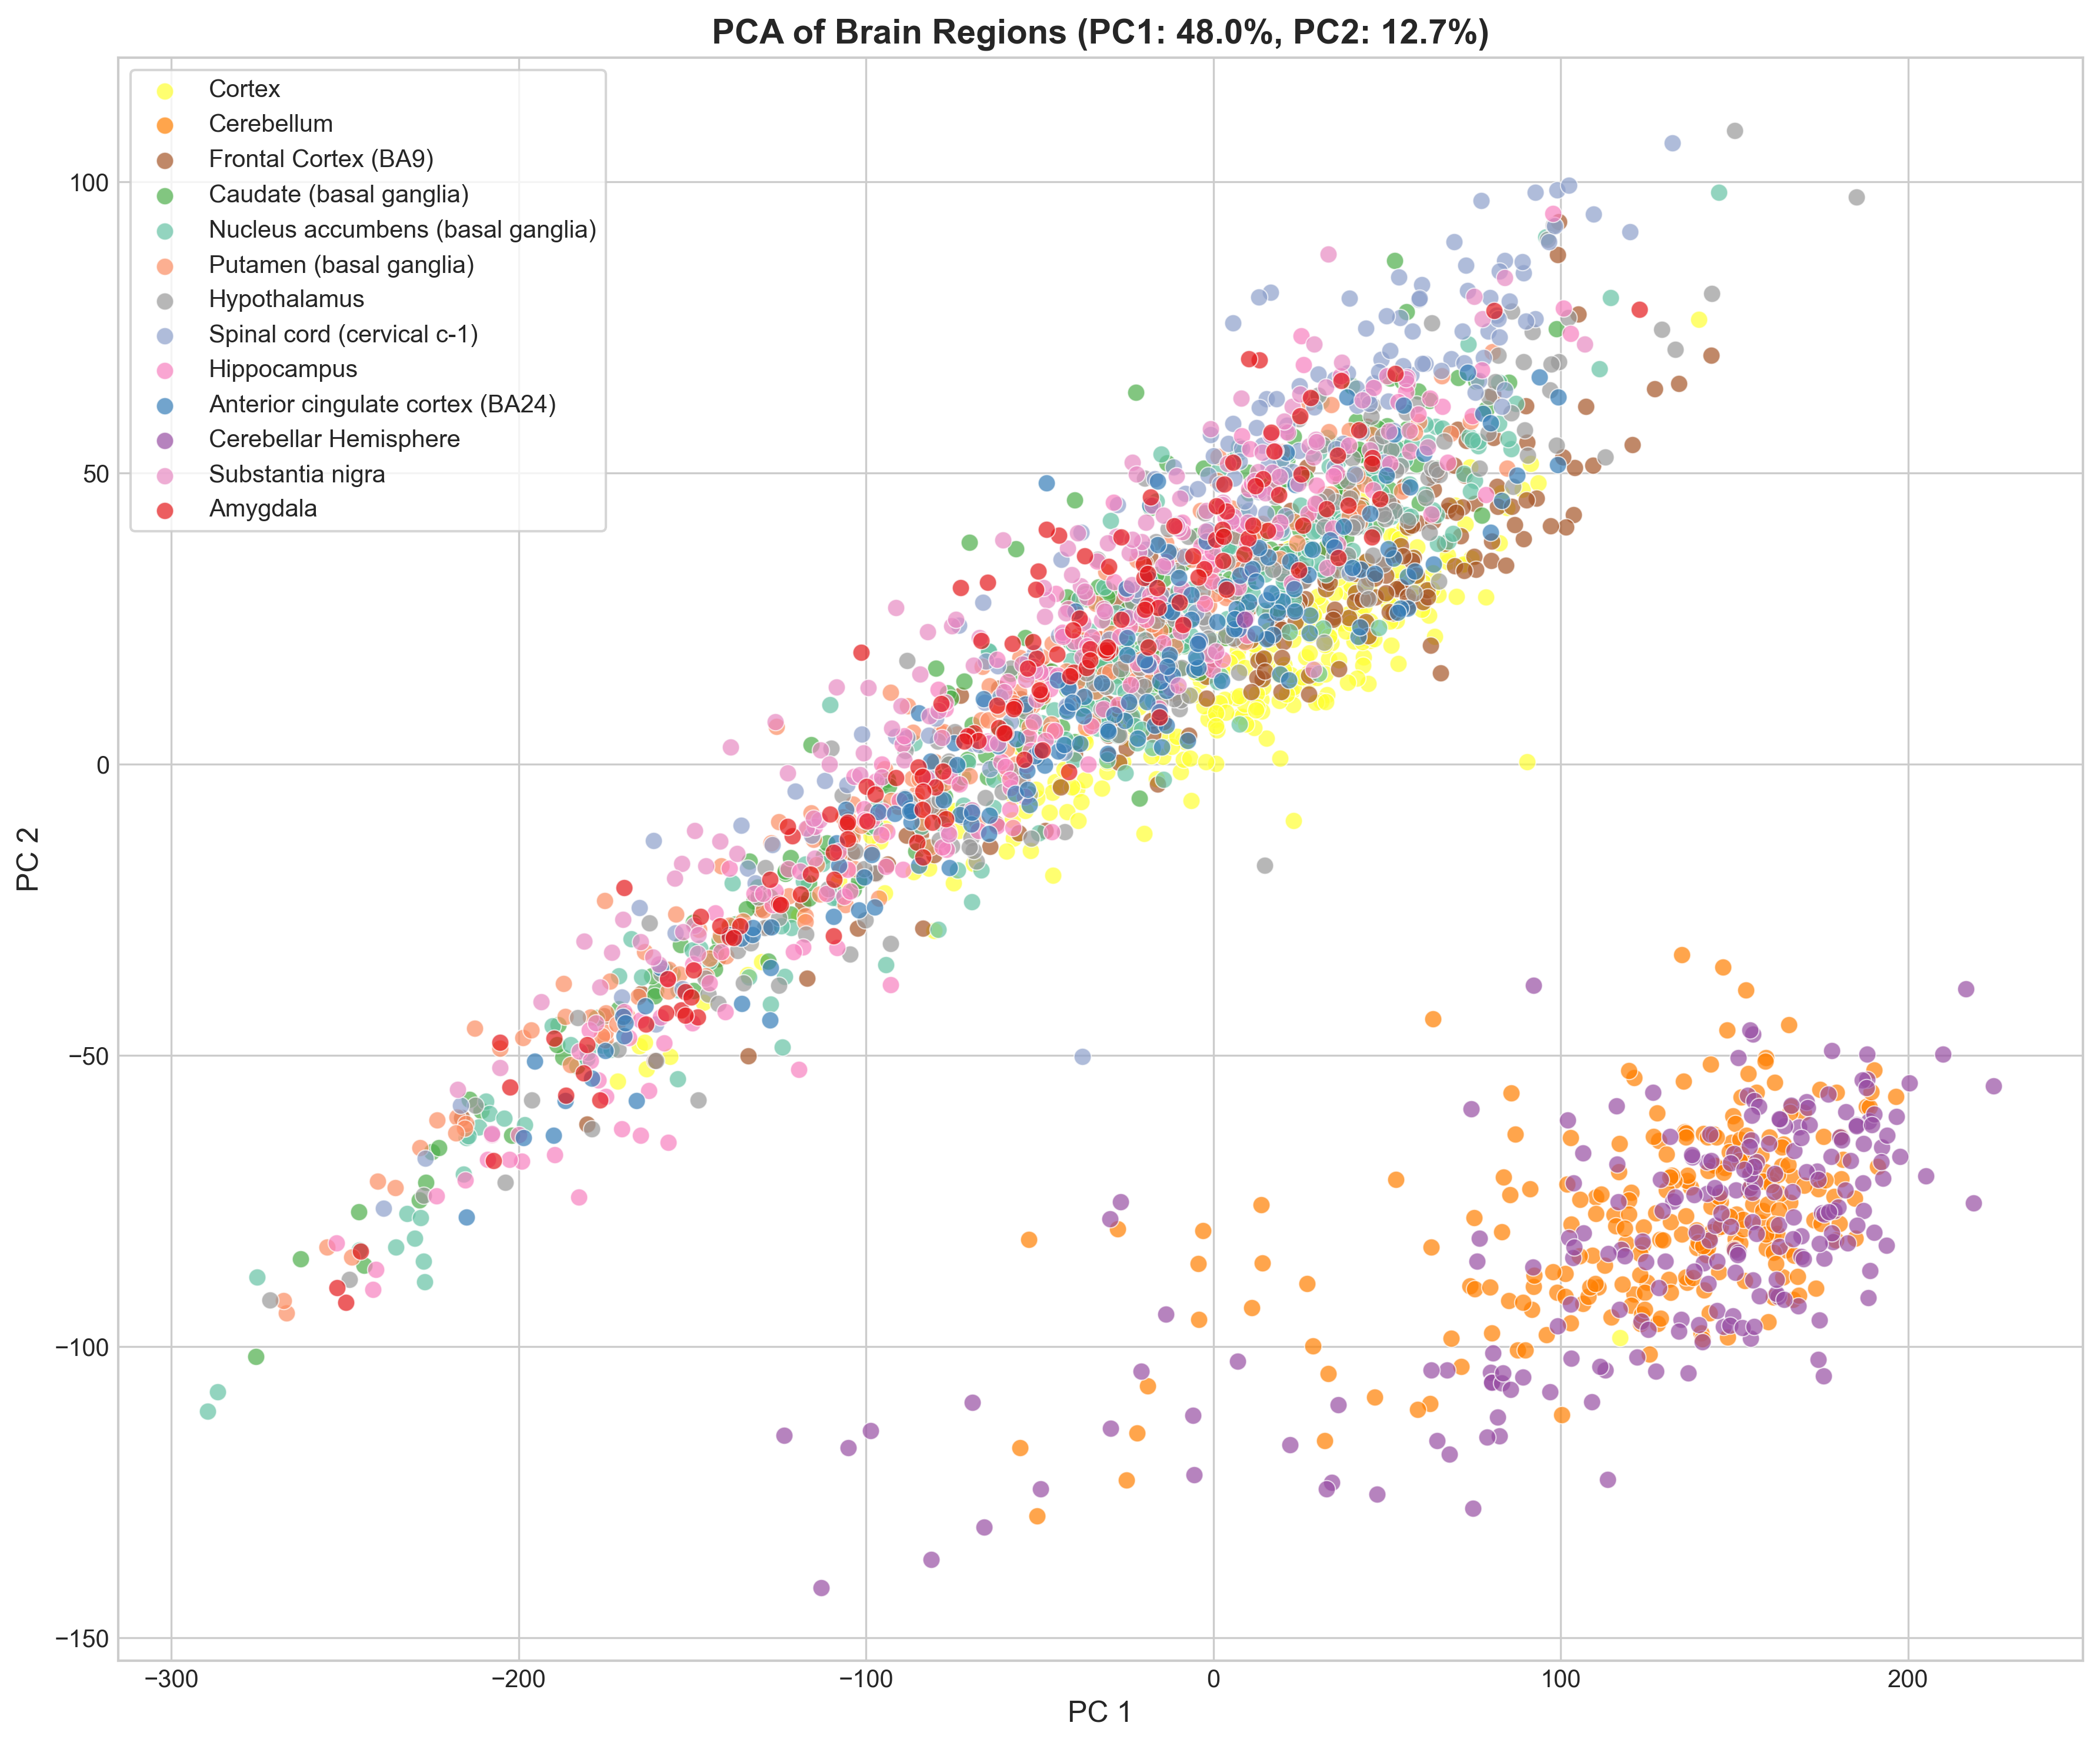
PCA on the standardized expression matrix shows that PC1 alone captures 48% of the variance, which is unusually high. It’s mostly separating the cerebellum from everything else. The top 50 PCs explain 90.2% of total variance.
In the PC1 vs PC2 scatter, the cerebellum (and cerebellar hemisphere) forms a tight, well-separated cluster. The remaining regions overlap more but still show structure: cortical regions cluster together, basal ganglia regions overlap, hypothalamus and spinal cord sit at the edges.
UMAP
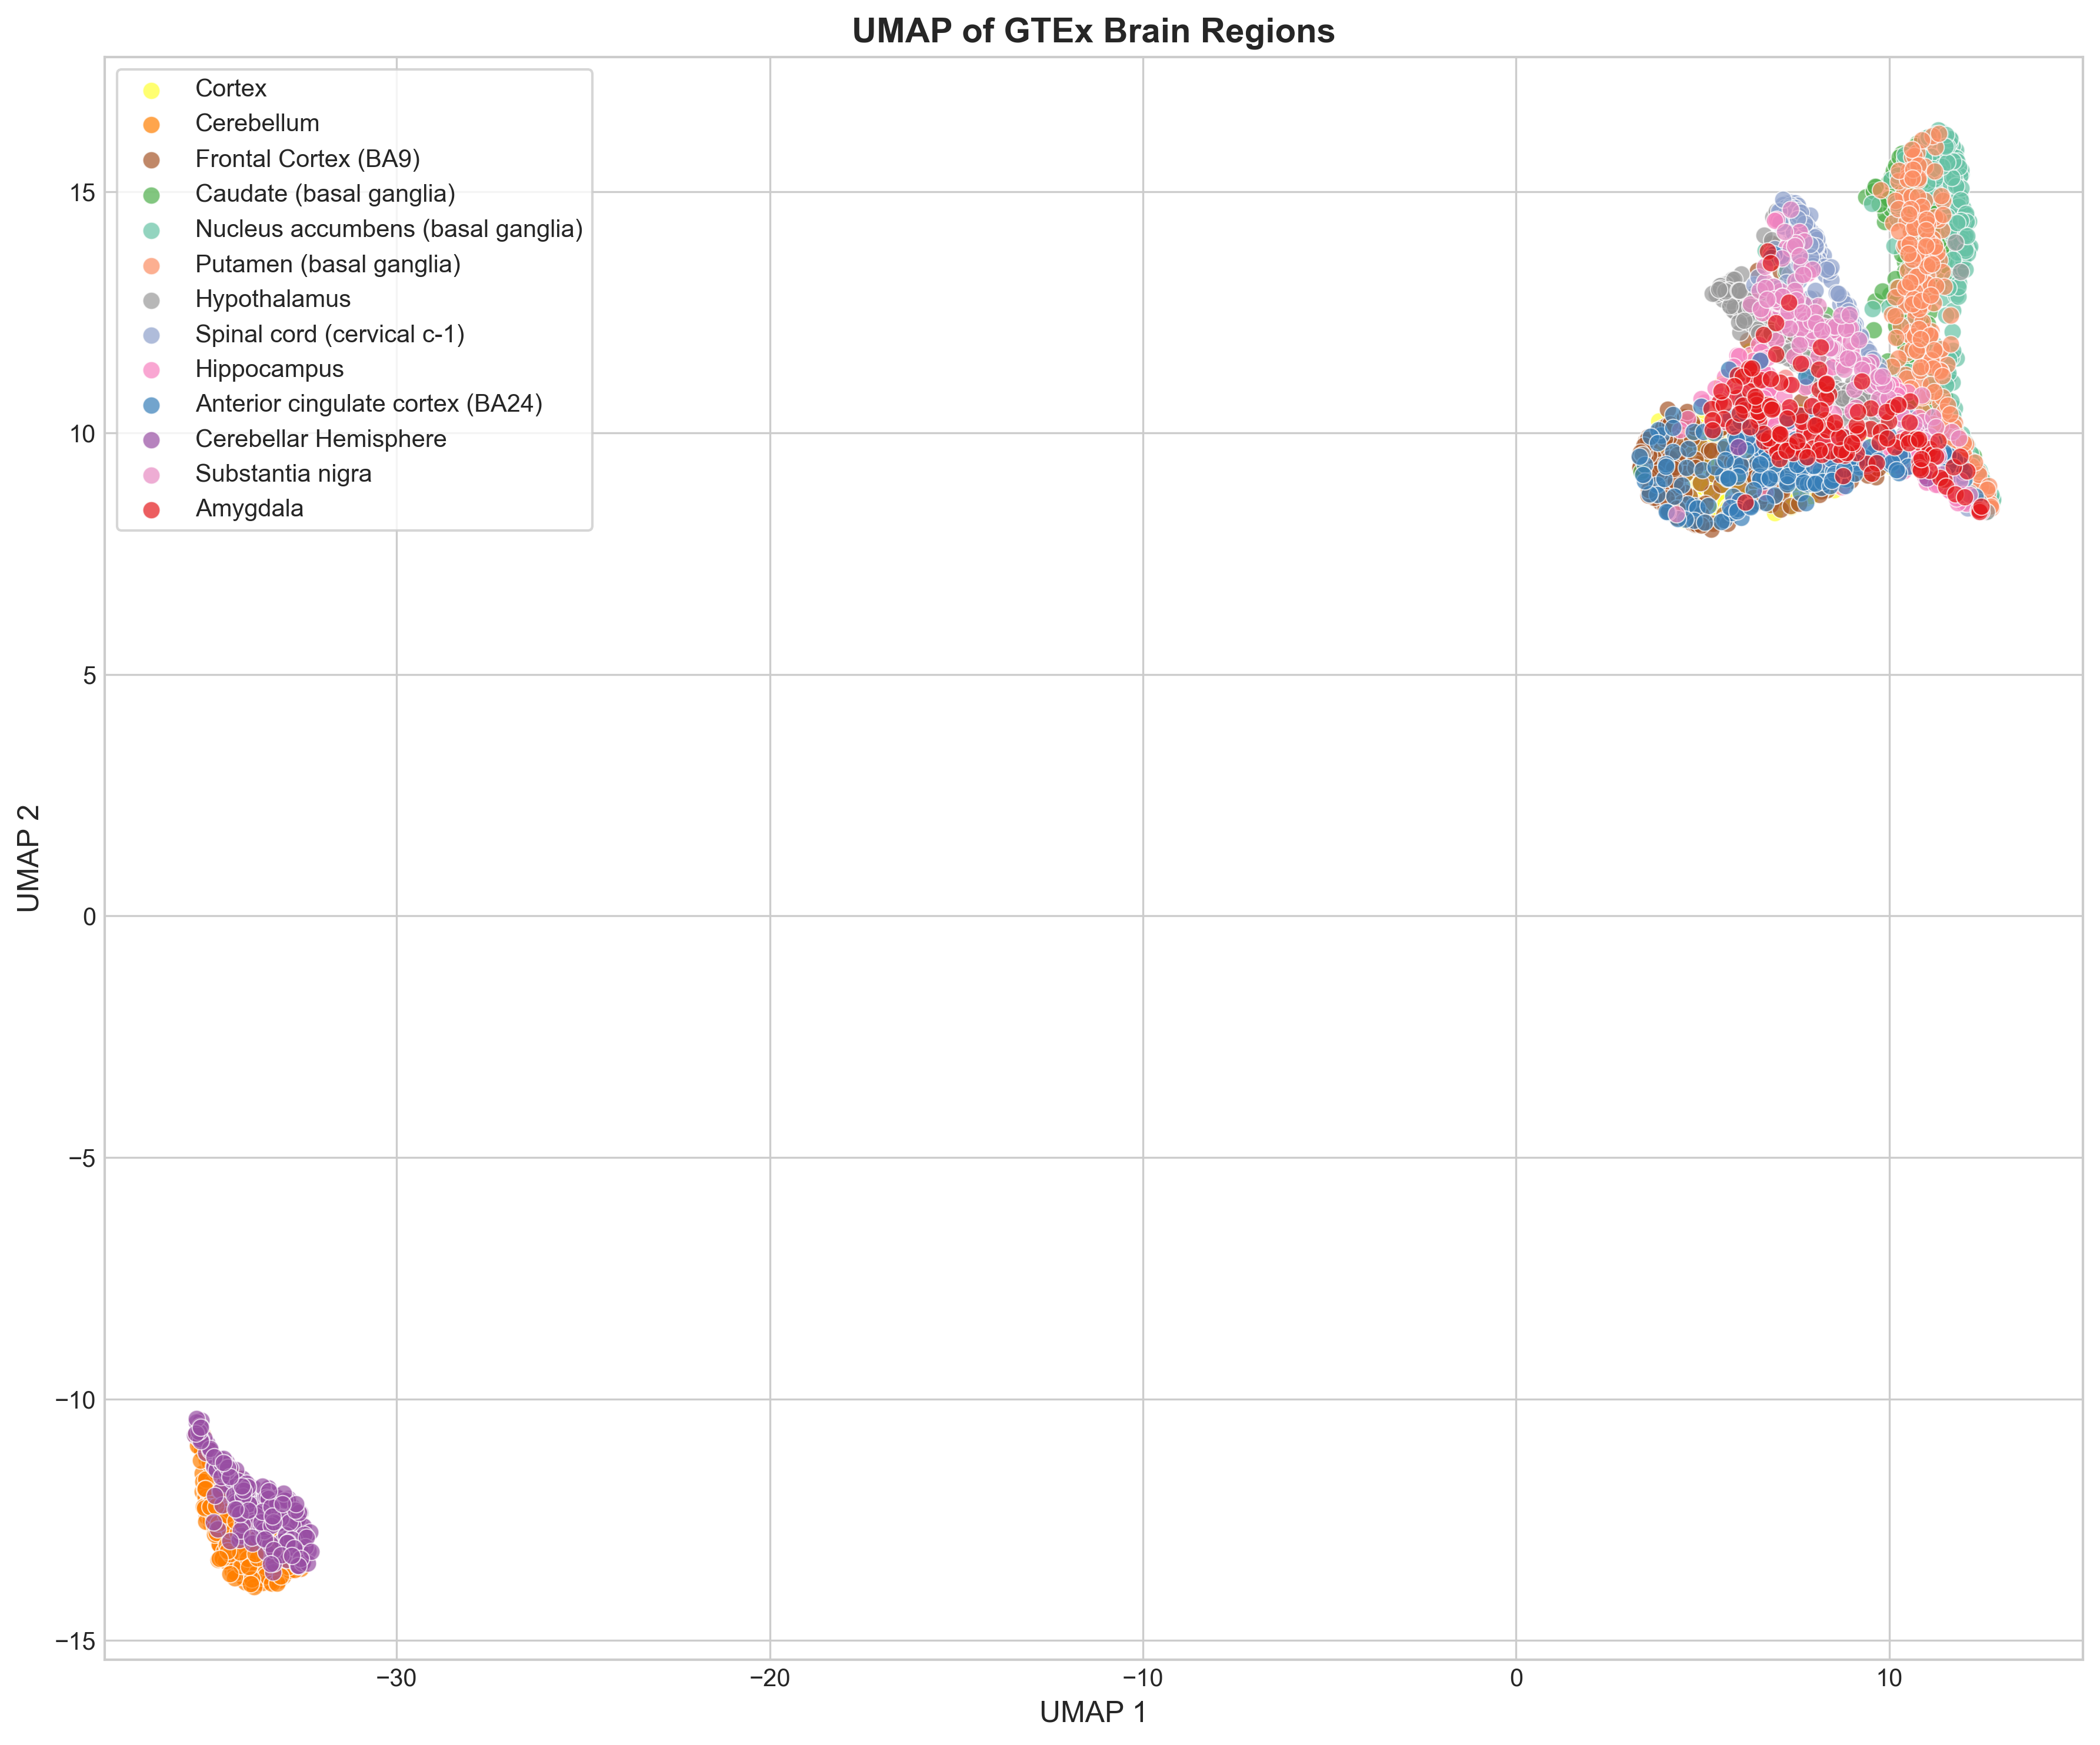
UMAP (fitted on the top 30 PCs, n_neighbors=30) resolves the structure better. Most regions form distinct clusters, with the expected exceptions: cortex and frontal cortex overlap a lot, and the three basal ganglia regions bleed into each other.
Region similarity
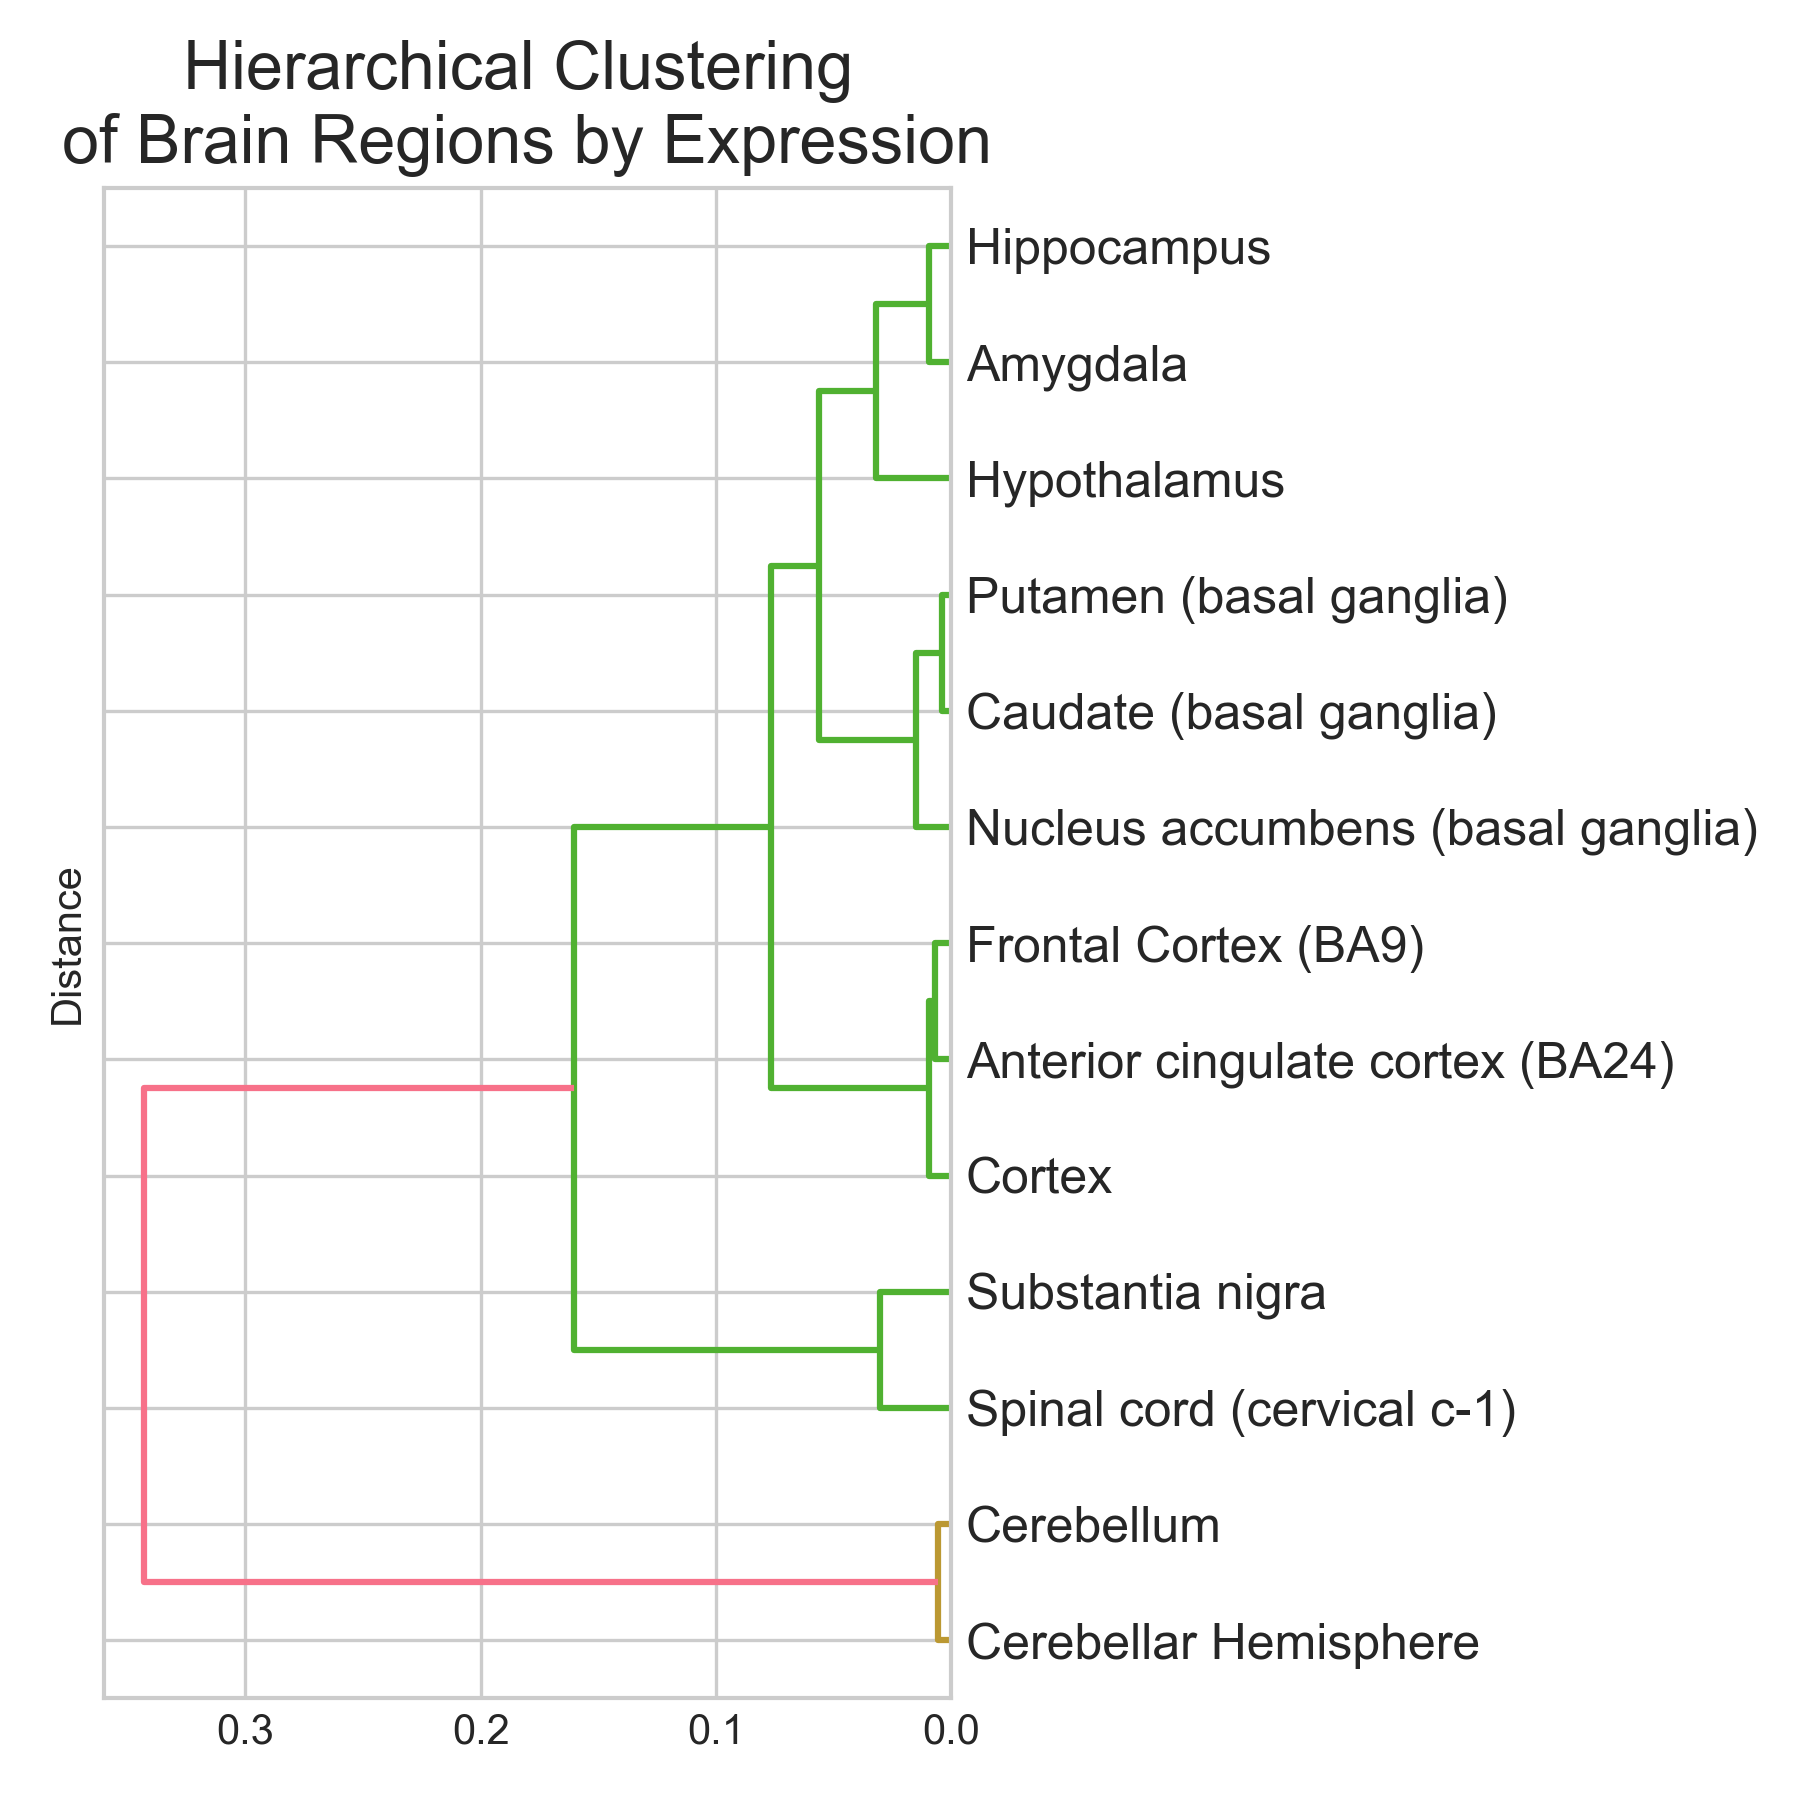
A correlation heatmap and hierarchical clustering of mean expression profiles line up with what the dimensionality reduction shows: brain regions cluster according to known neuroanatomy.

The cerebellum branches off first (it’s the most transcriptionally distinct). Cortical regions cluster together. The three basal ganglia structures are nearest neighbors, which tracks with their shared developmental origin from the lateral ganglionic eminence and their overlapping medium spiny neuron populations.
Classification
Three models were trained on an 80/20 stratified split:
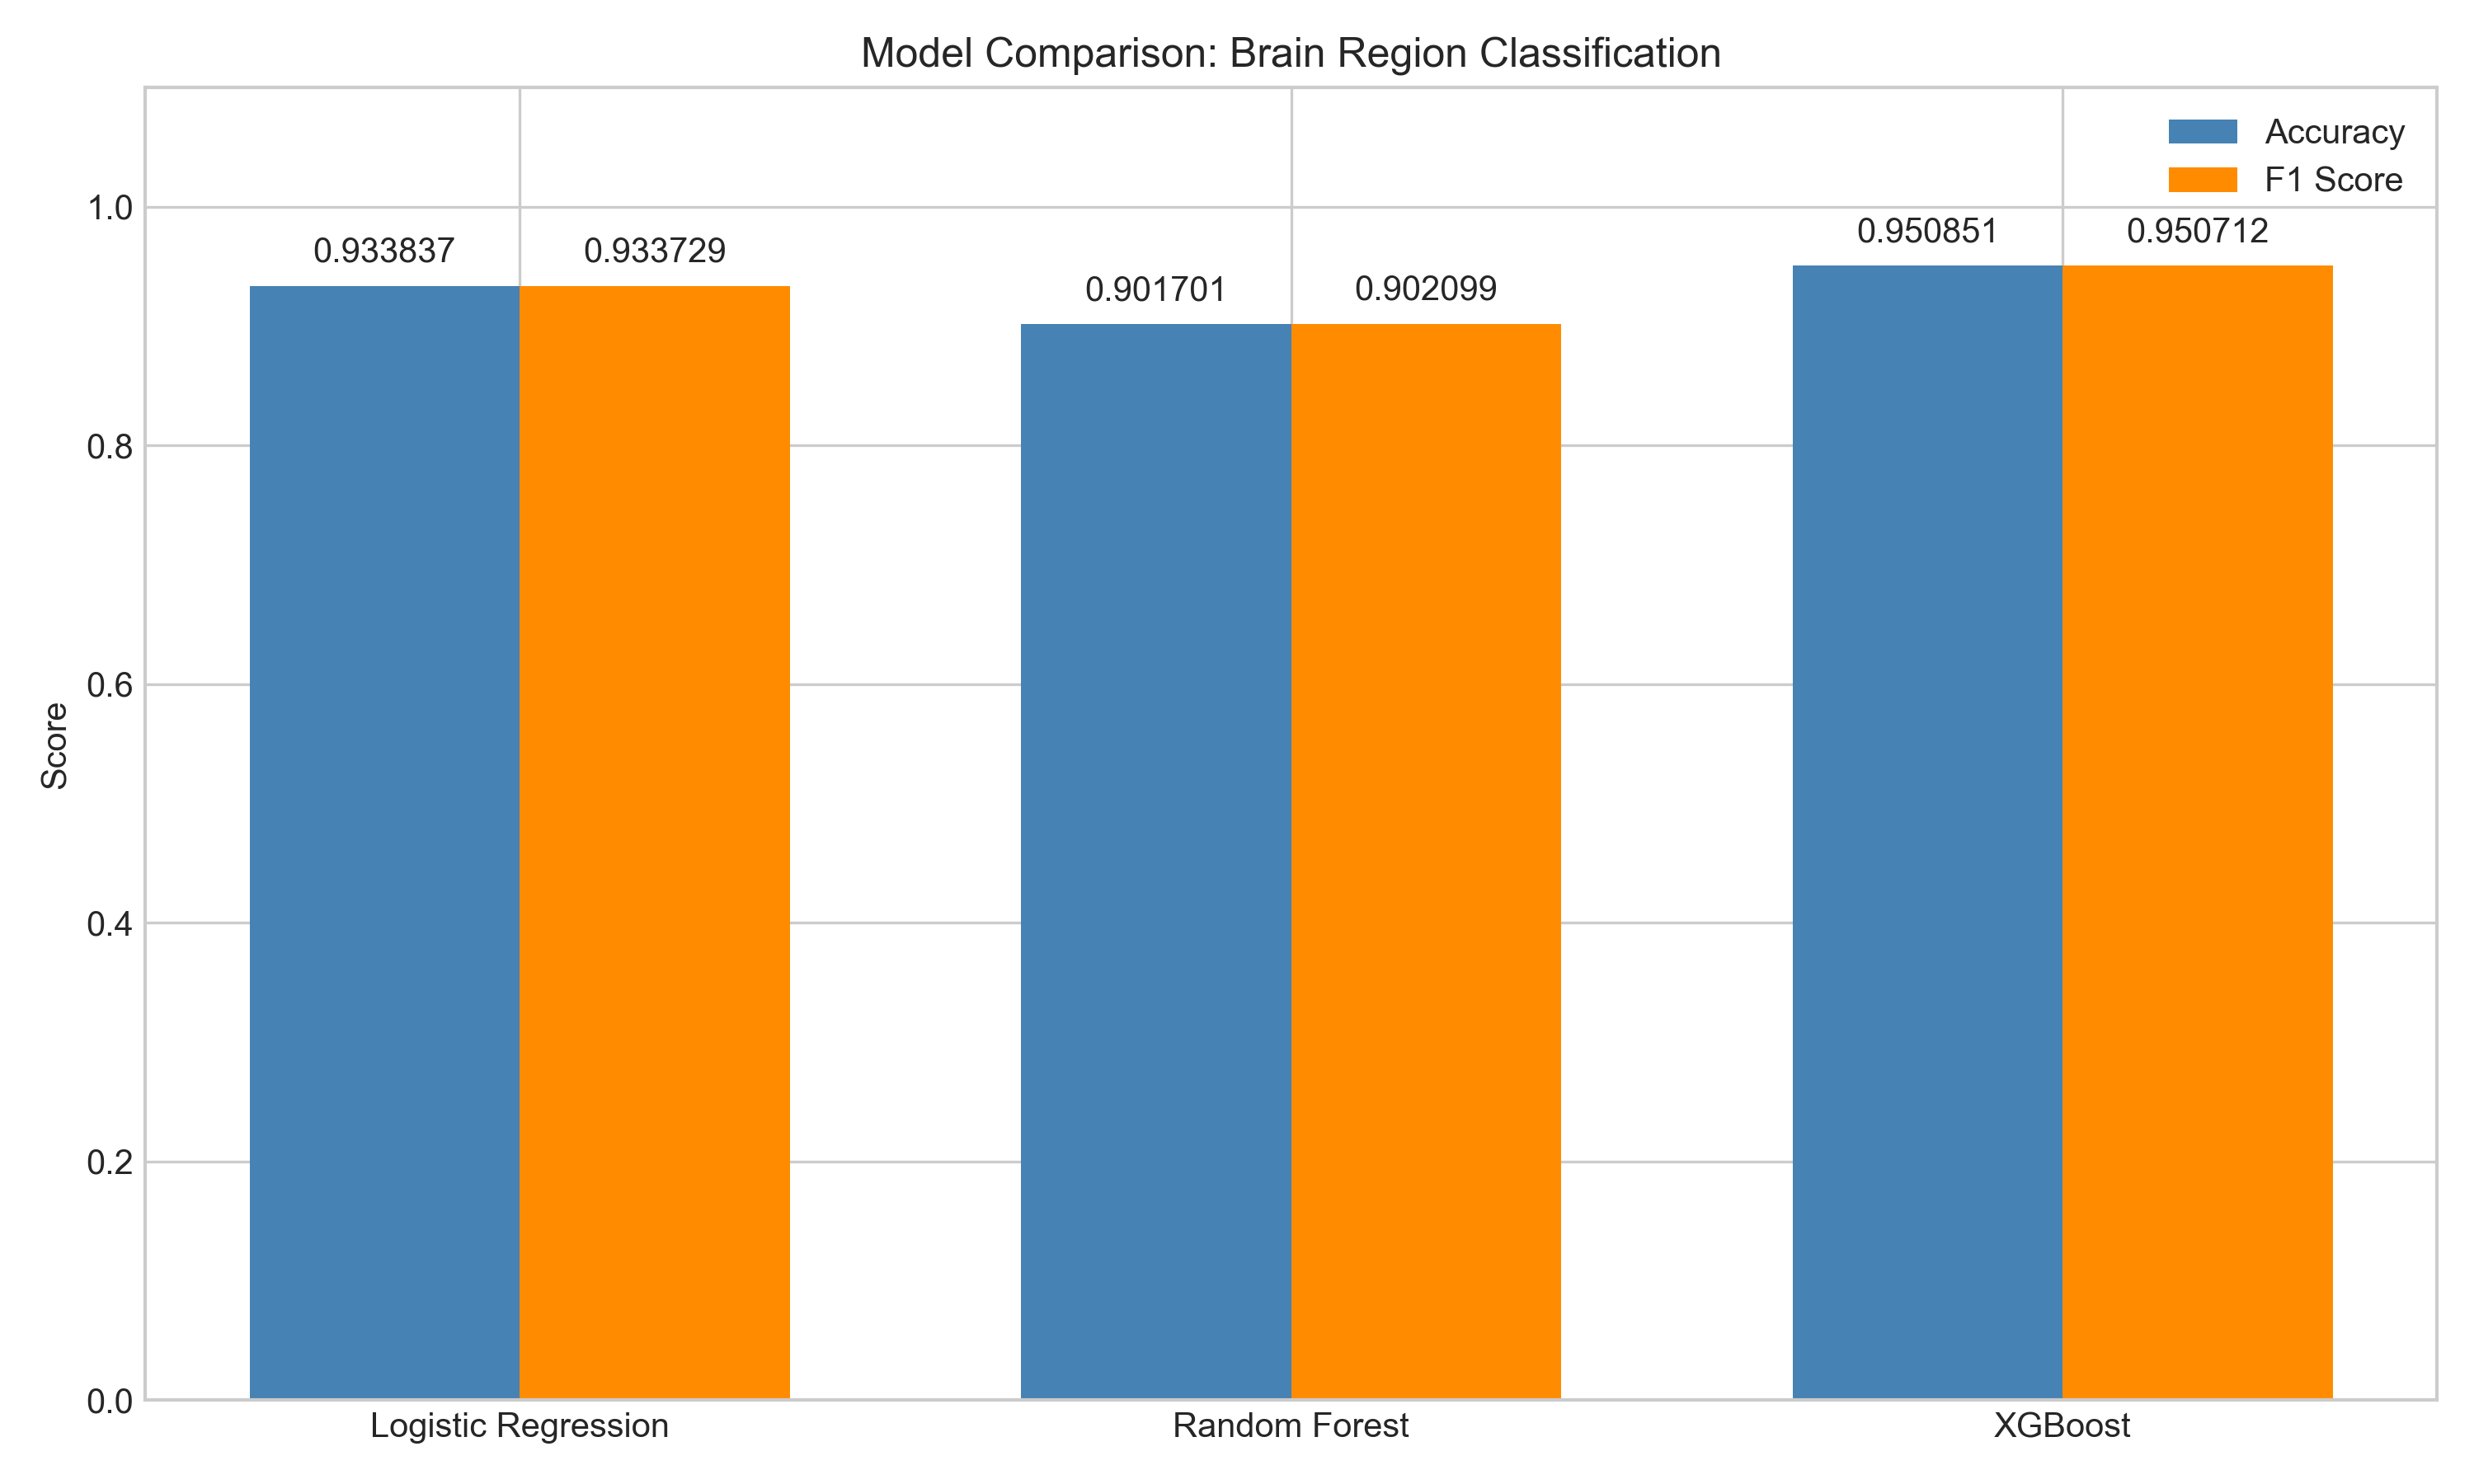
| Model | Accuracy | F1 (weighted) |
|---|---|---|
| Logistic Regression | 0.934 | 0.934 |
| Random Forest | 0.902 | 0.902 |
| XGBoost | 0.951 | 0.951 |
XGBoost won comfortably. 5-fold stratified cross-validation confirmed it: 94.9 +/- 0.9% accuracy, fold scores from 0.939 to 0.962.
Per-region performance
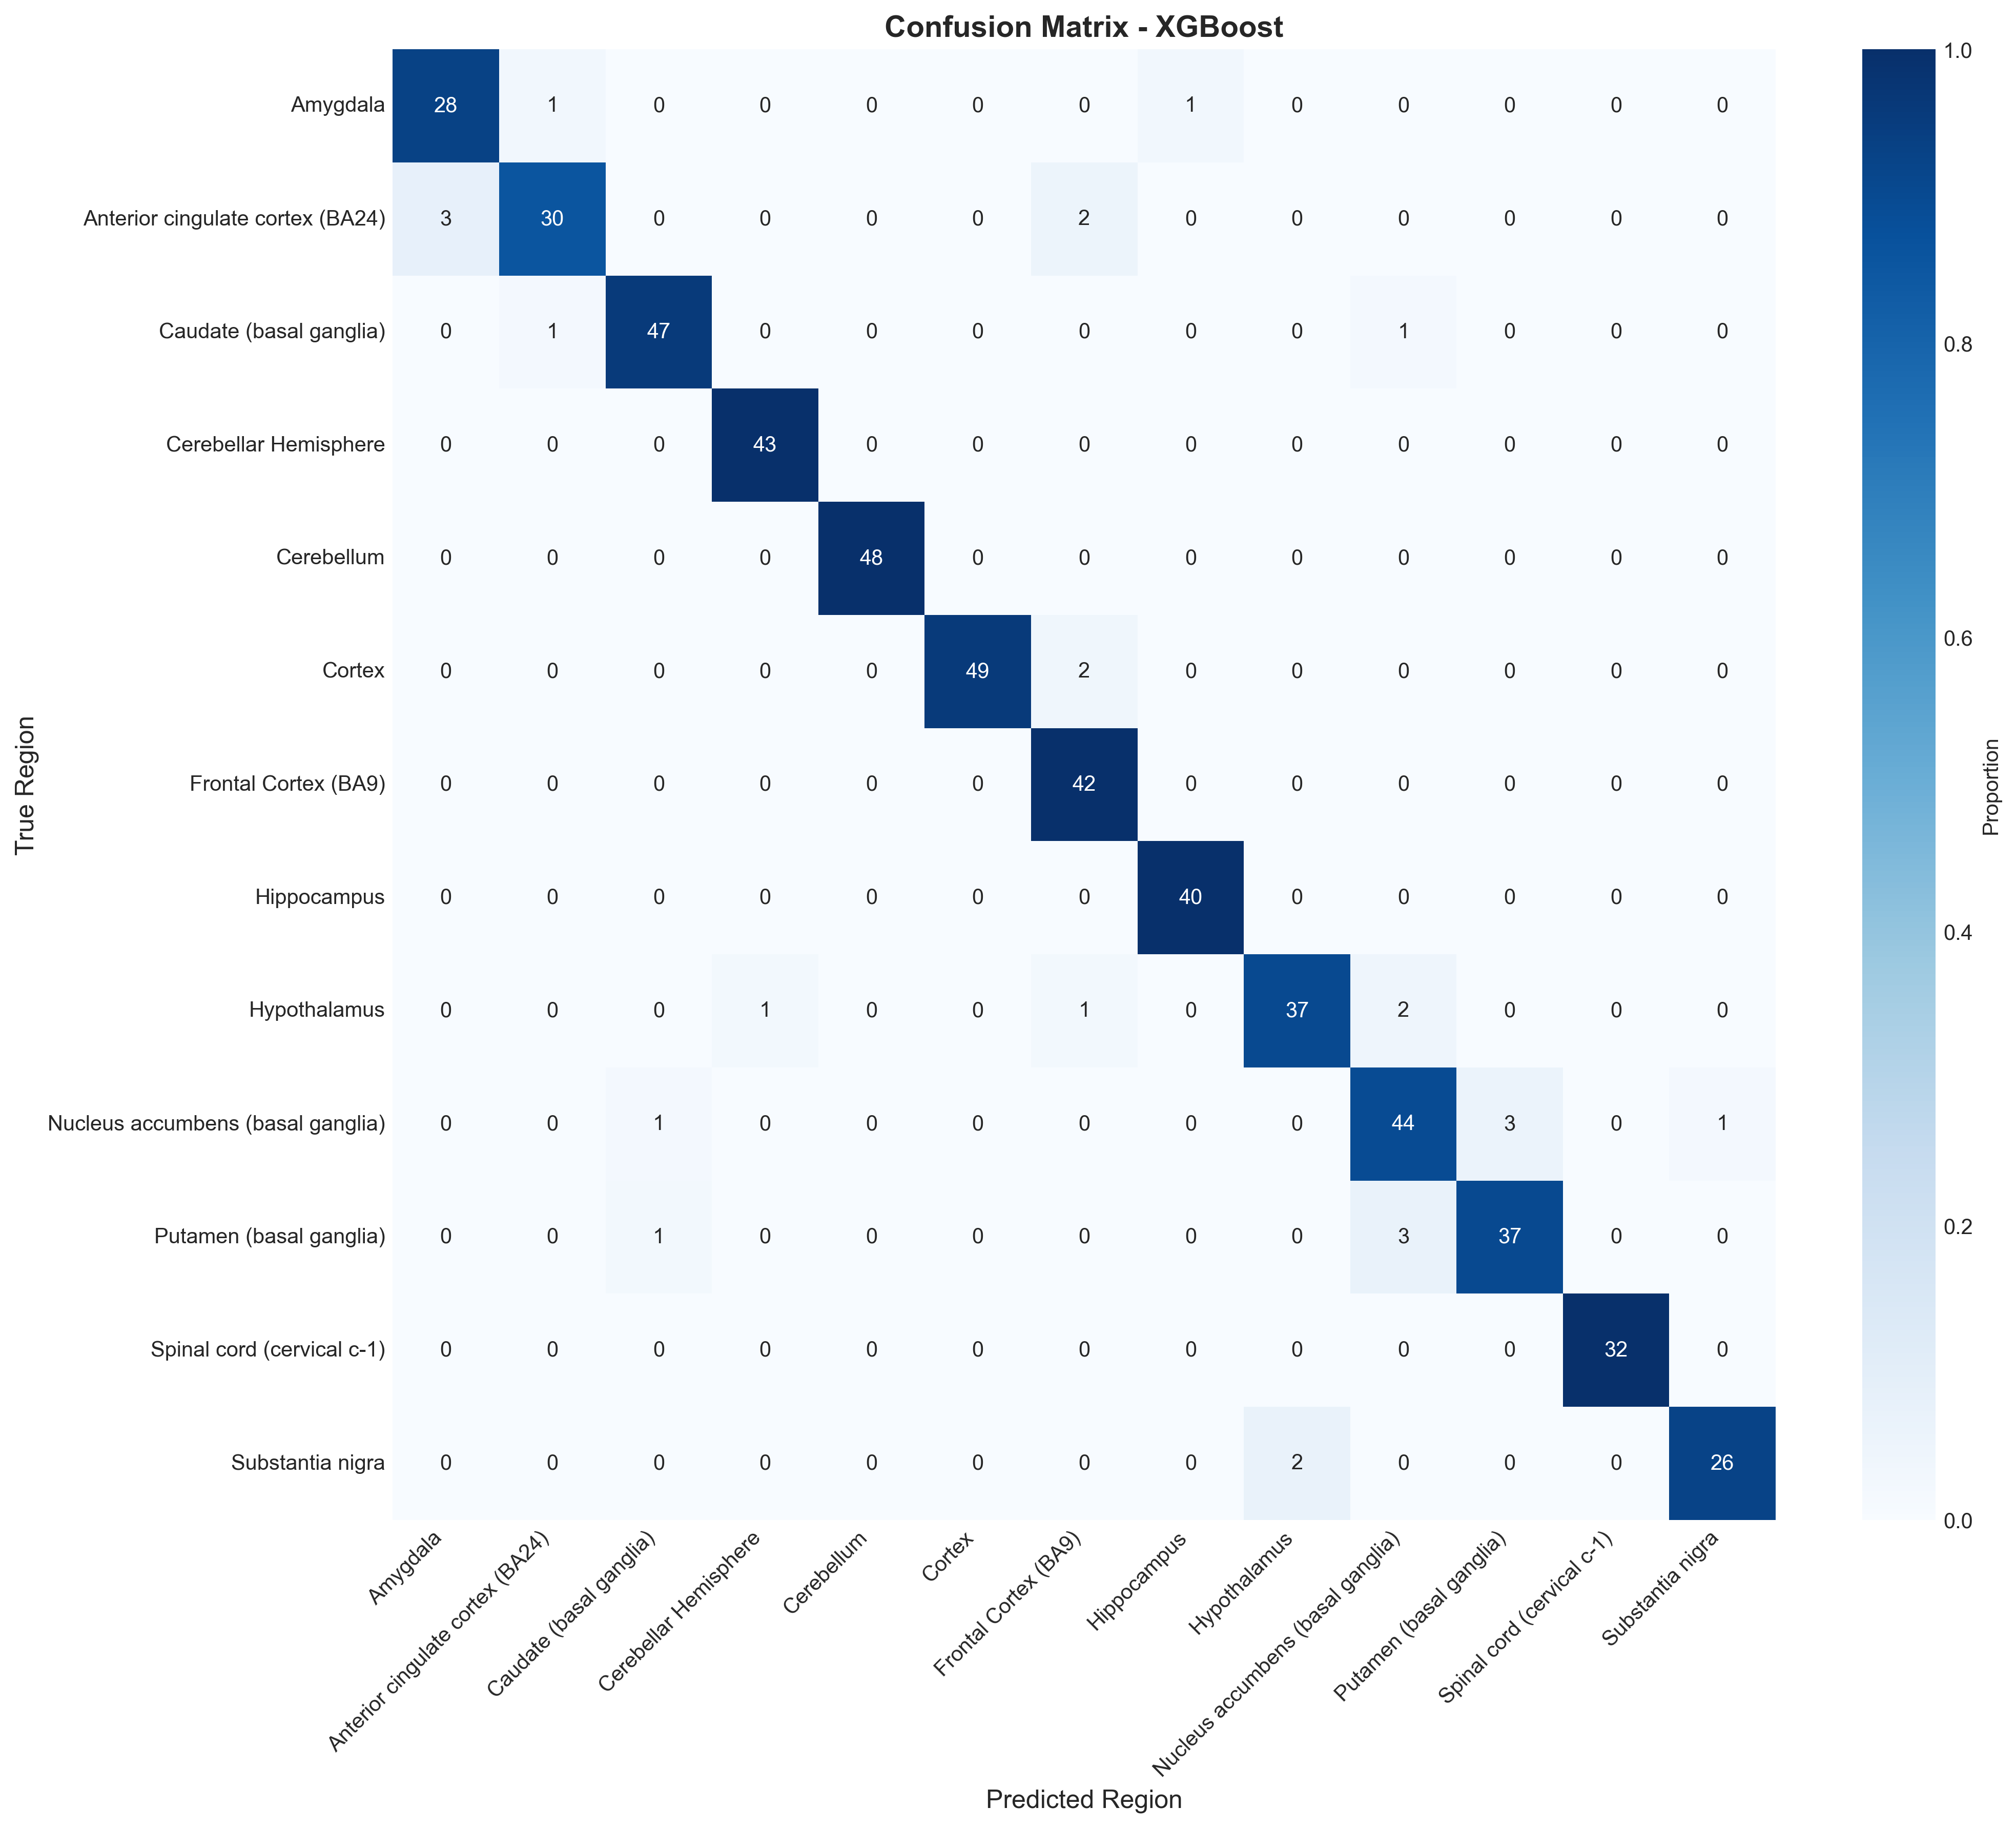
The confusion matrix and per-class metrics break down as you’d expect:
- F1 = 1.00: Cerebellum, Cerebellar Hemisphere, Spinal cord
- F1 > 0.95: Cortex, Hippocampus, Caudate
- F1 ~ 0.89-0.92: Amygdala, Nucleus accumbens, Putamen
The basal ganglia confusion is biologically expected. Caudate, putamen, and nucleus accumbens share cell types and transcriptional programs. Worth noting that Logistic Regression came close (93.4% vs 95.1%), which suggests the expression differences between regions are mostly linearly separable already.
Biological interpretation
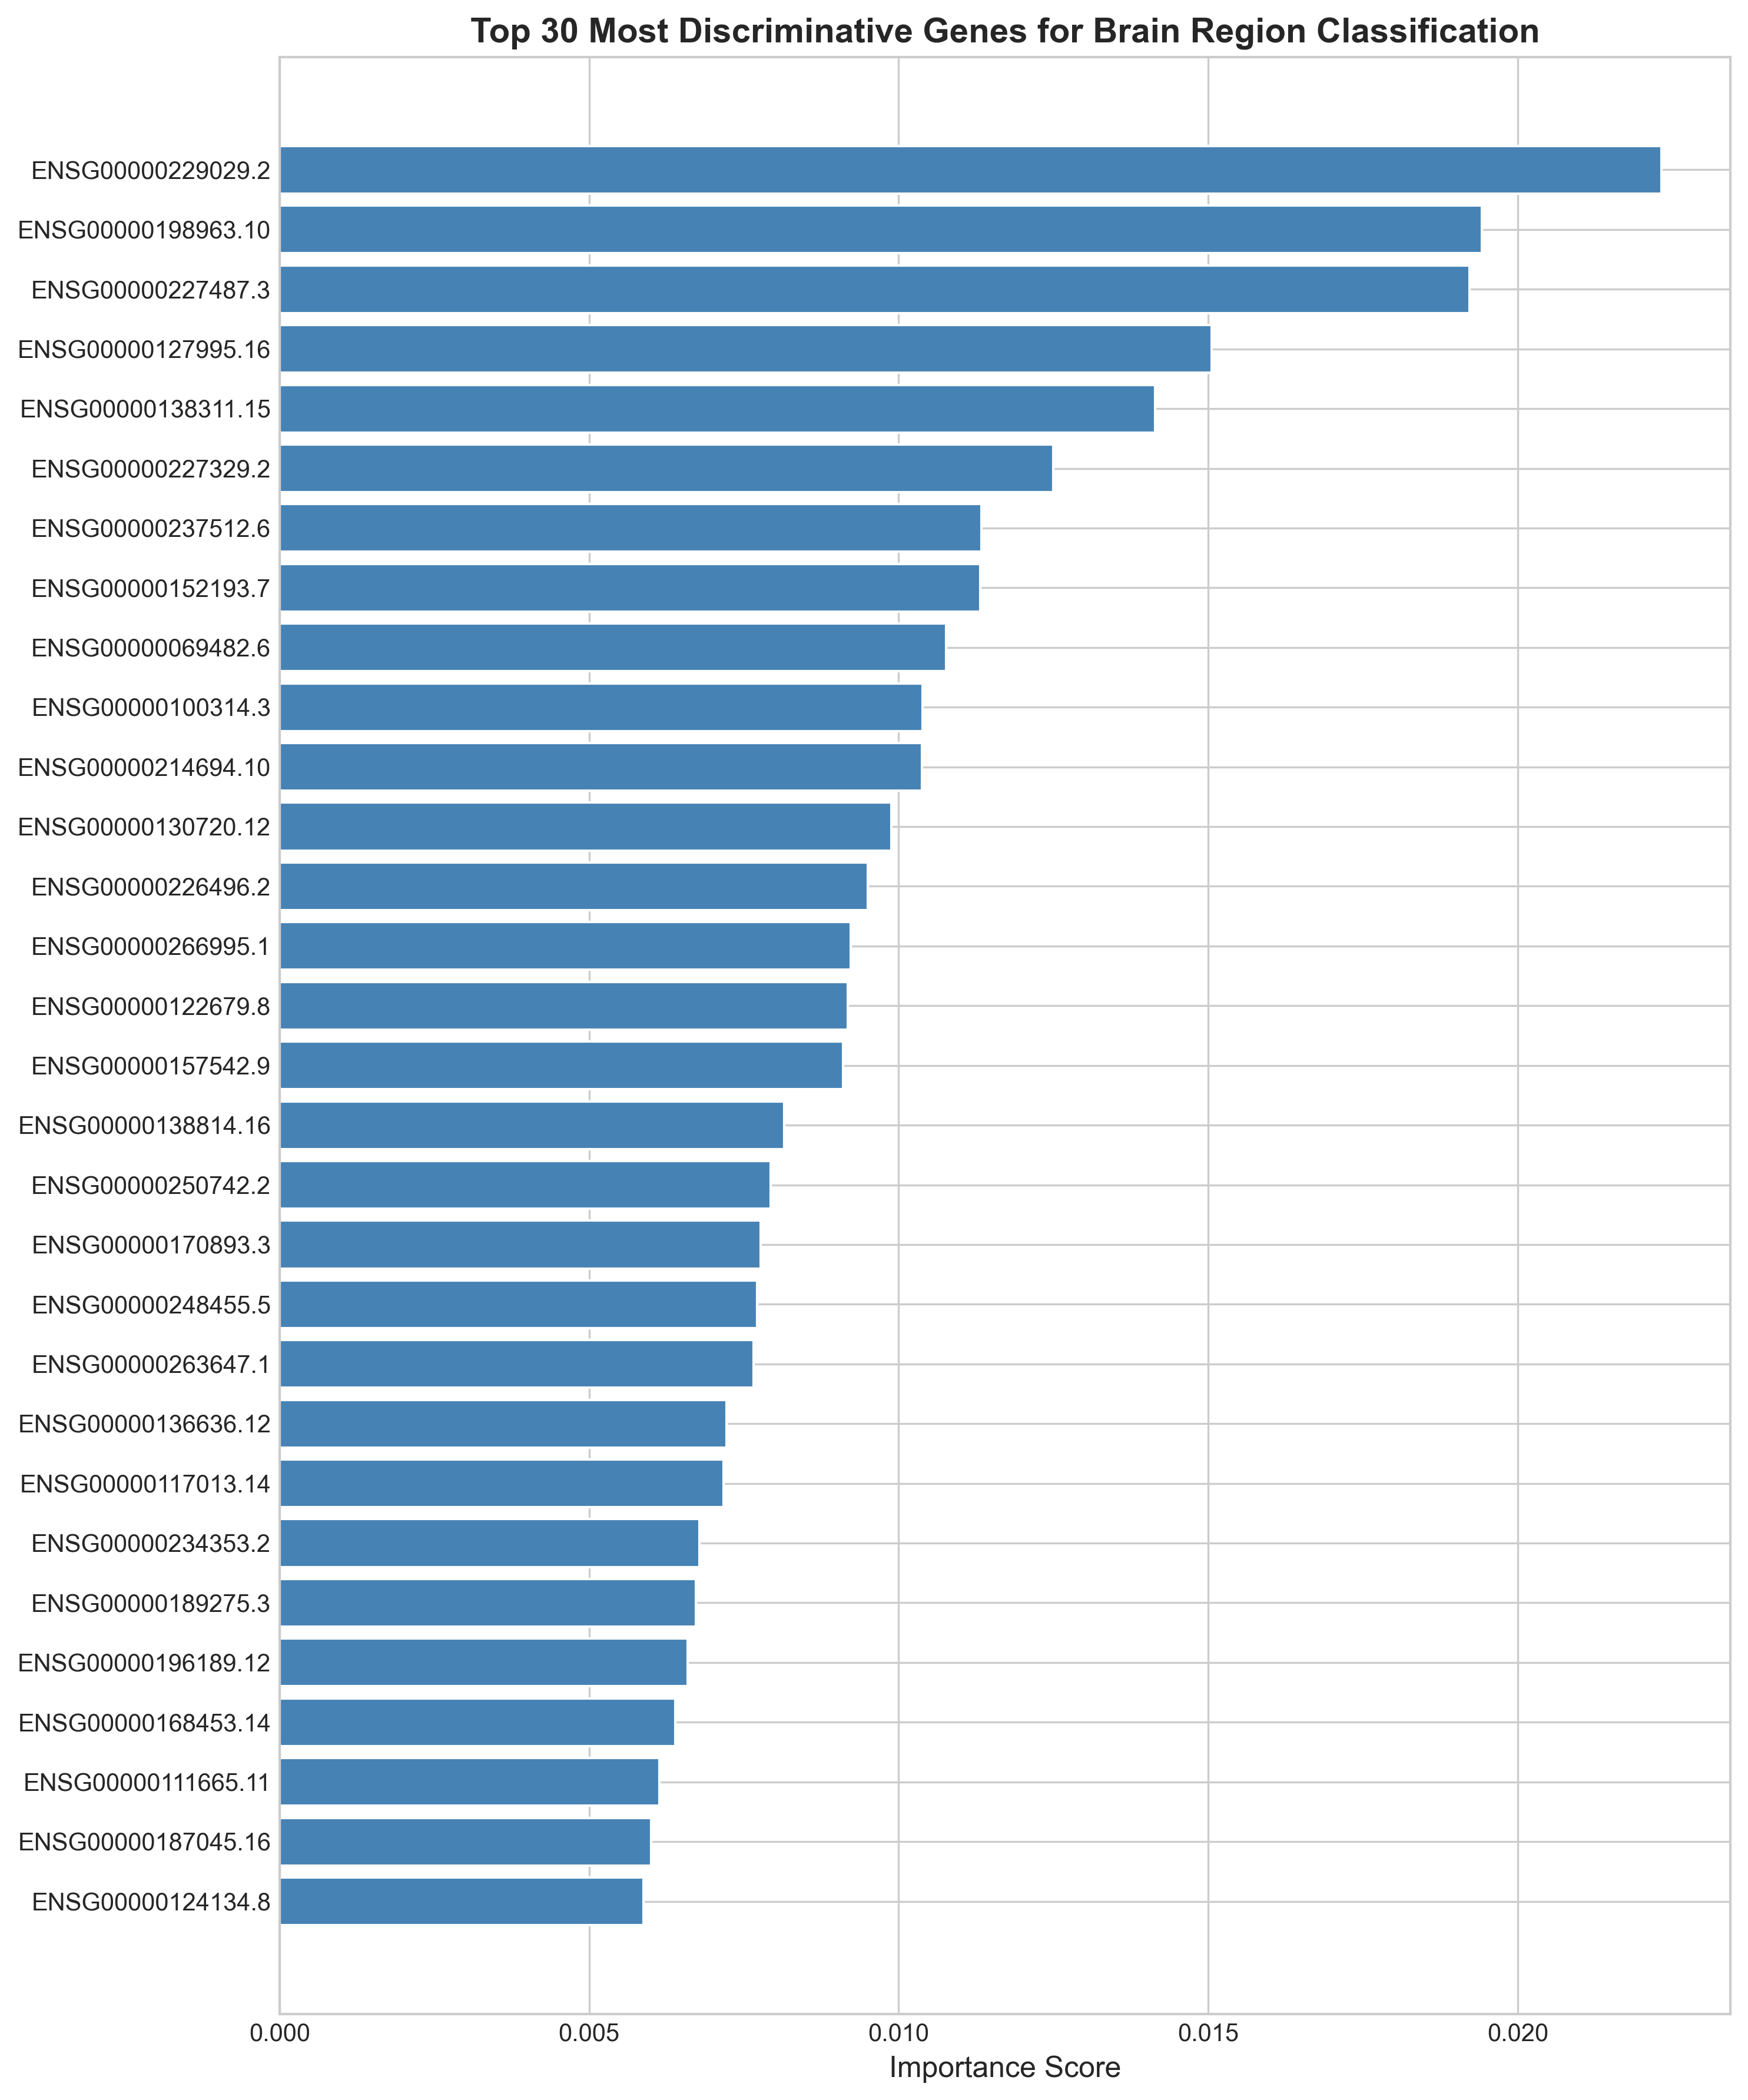
I annotated the top 100 discriminative genes (by XGBoost split-gain importance) using the Ensembl REST API and checked whether they match known brain region biology. Short answer: yes.
What the classifier actually learned
The top 30 genes fall into recognizable groups:
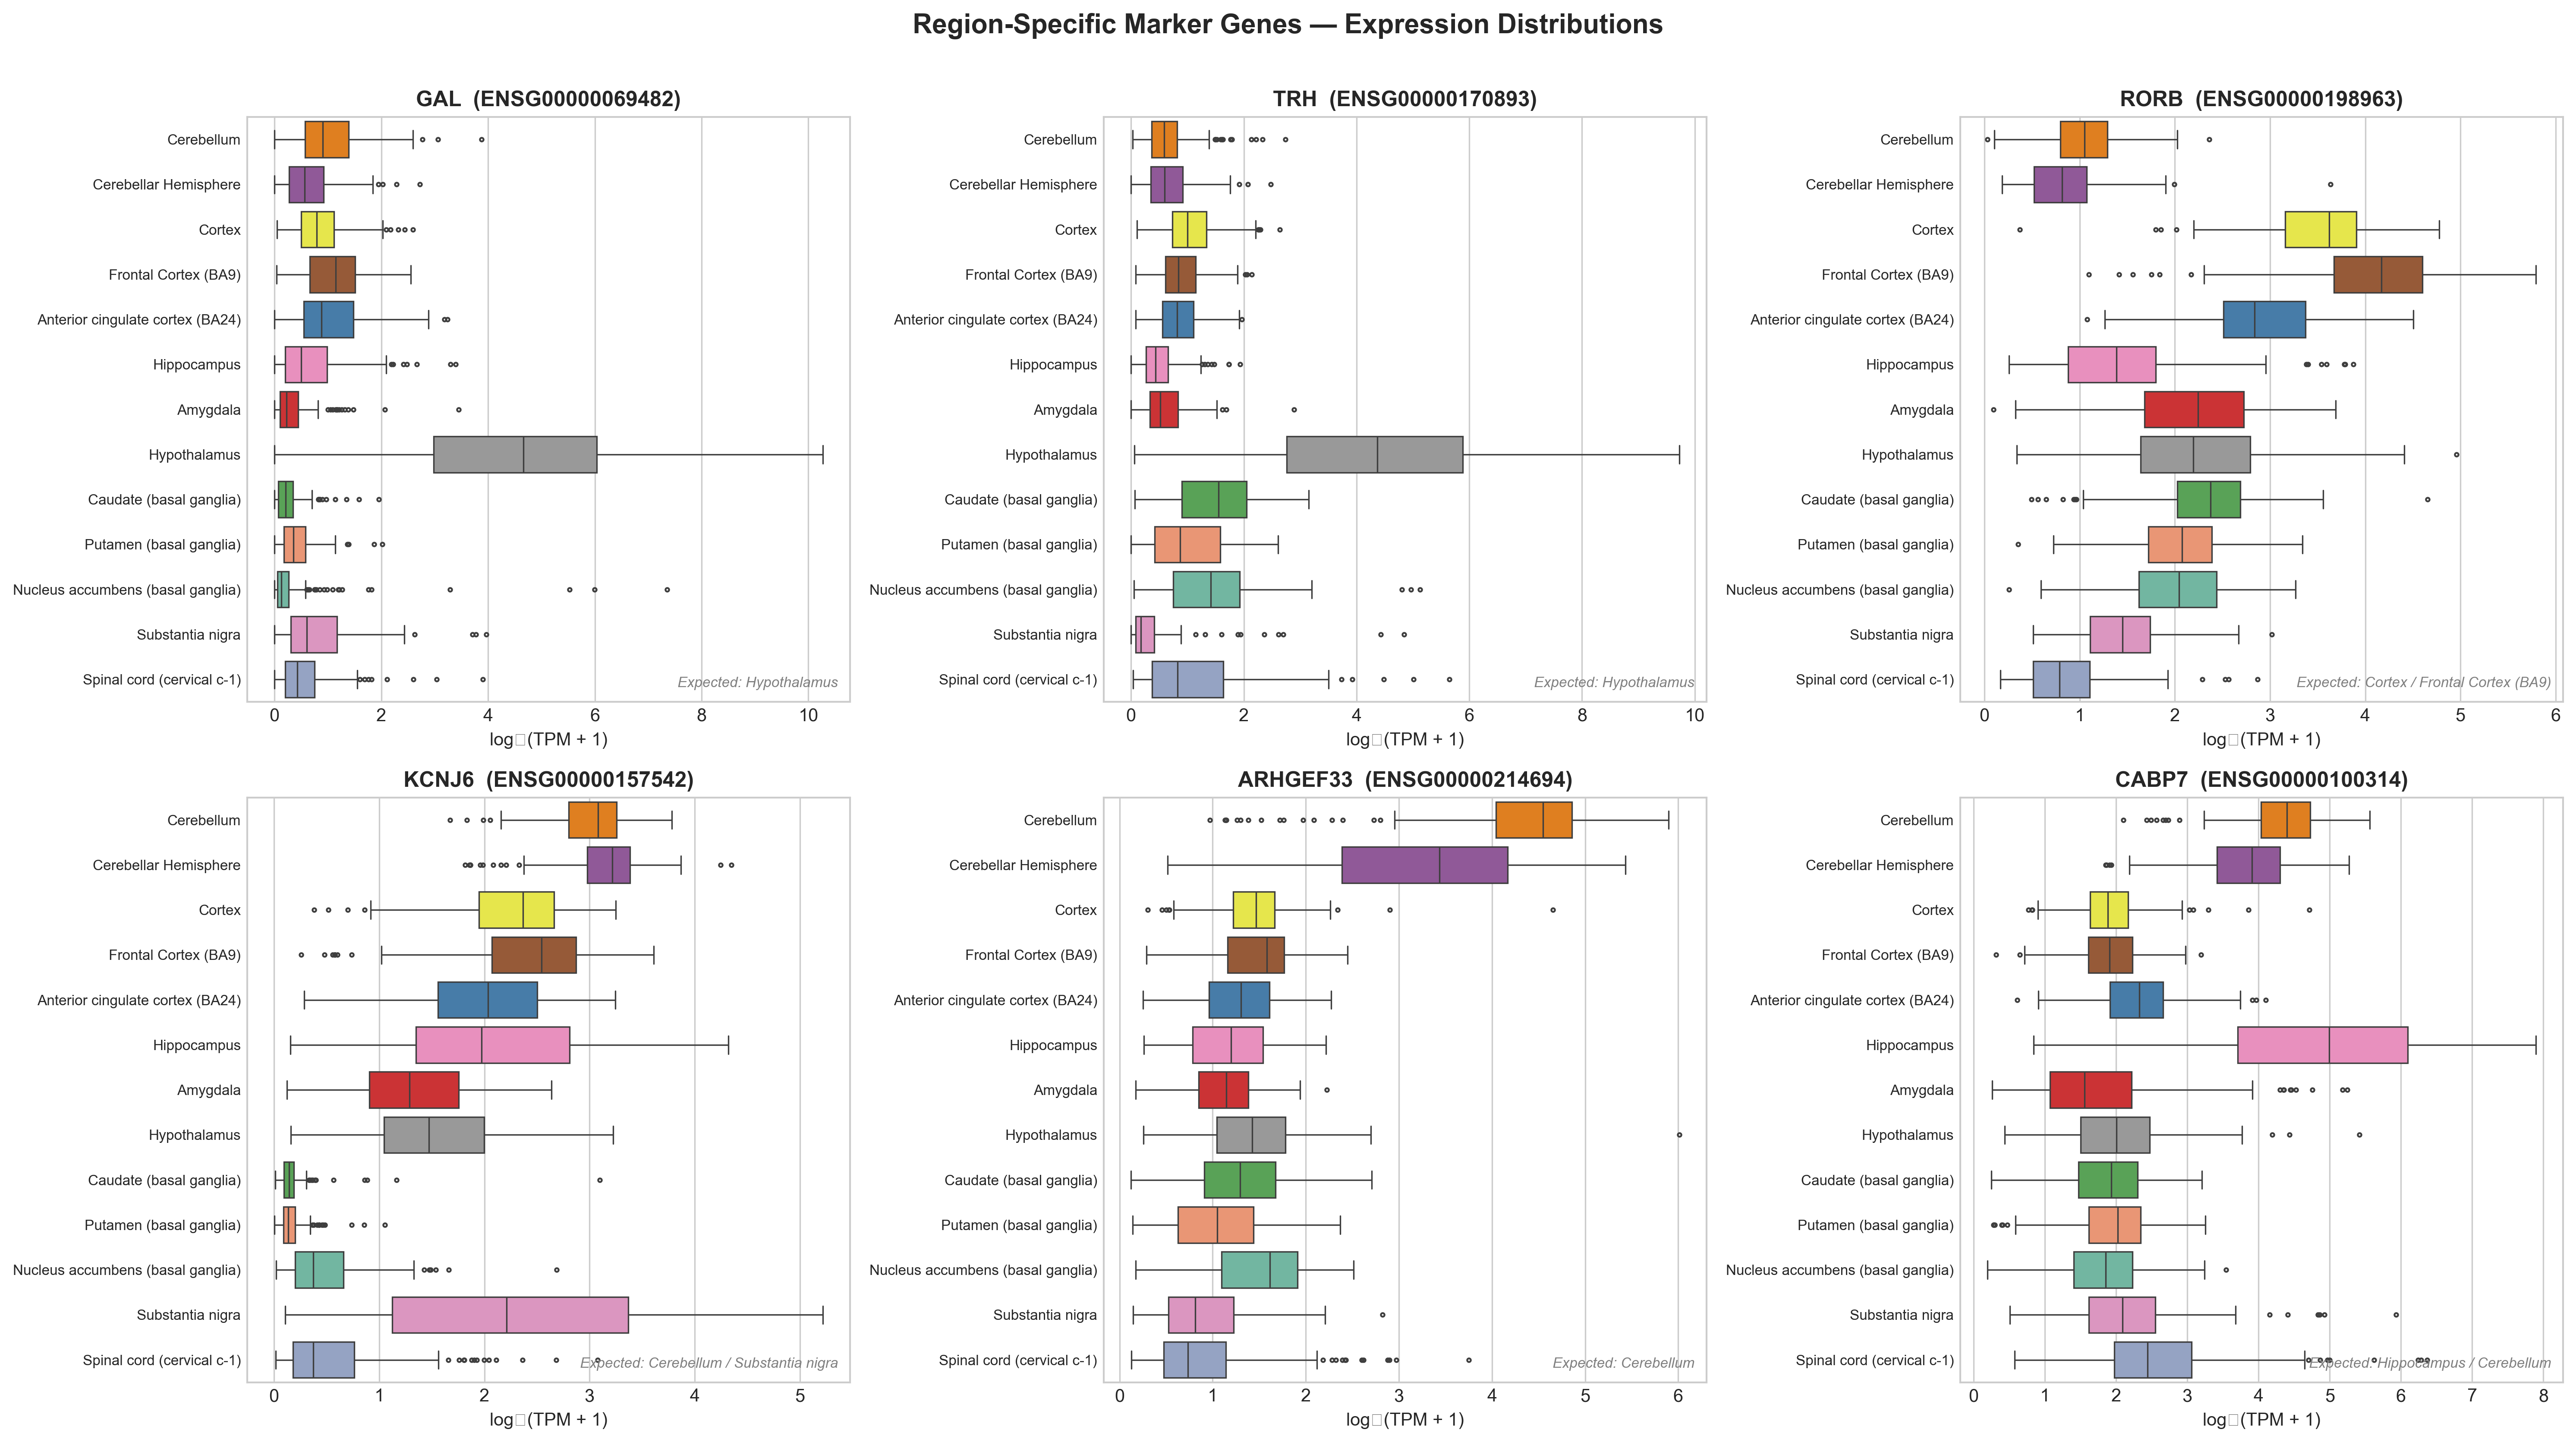
Hypothalamic neuropeptides (GAL, TRH). Both are textbook hypothalamic markers. GAL (galanin, rank #9) is a major inhibitory neuropeptide concentrated in the hypothalamus, involved in feeding and sleep-wake regulation. TRH (rank #19) is synthesised primarily in the paraventricular nucleus and controls the hypothalamic-pituitary-thyroid axis.
Cerebellar markers (ARHGEF33, HR, KCNJ6, CASD1, FIBCD1). The cerebellum has a cytoarchitecture unlike any other brain region: Purkinje cells, granule cells, Bergmann glia. The model classifies it perfectly, and these genes explain why. ARHGEF33 is overexpressed 12x in cerebellum vs. other regions. HR (Hairless) is required for Purkinje cell structural maintenance. KCNJ6 (GIRK2) is a K+ channel abundant in cerebellar granule cells. The weaver mouse, which carries a Kcnj6 missense mutation, exhibits massive granule cell loss.
Cortical identity (RORB, PPP3CA). RORB at rank #2 is a good sanity check. It’s the standard transcriptomic marker for cortical layer IV, used in the Allen Brain Atlas and Human Cell Atlas. PPP3CA (calcineurin) is enriched in cortex and hippocampus and is involved in synaptic plasticity.
Ion channels (KCNJ6, KCNQ4, KCNS1, KCTD3, CABP7). Different brain regions have different resting potentials, firing patterns, and ionic conductances. Four potassium channel genes and one calcium-binding protein in the top 30 encode that variation.
Non-coding RNAs (6 of top 30). The brain expresses more lncRNAs than any other organ. Several of these are antisense to known neural genes (NCAM1-AS1, UNC5B-AS1), suggesting they’re cis-regulatory elements whose expression mirrors the region-specific regulation of their sense-strand partners.
Expression patterns
A z-scored heatmap of the top 30 genes across regions shows distinct, region-specific expression blocks:
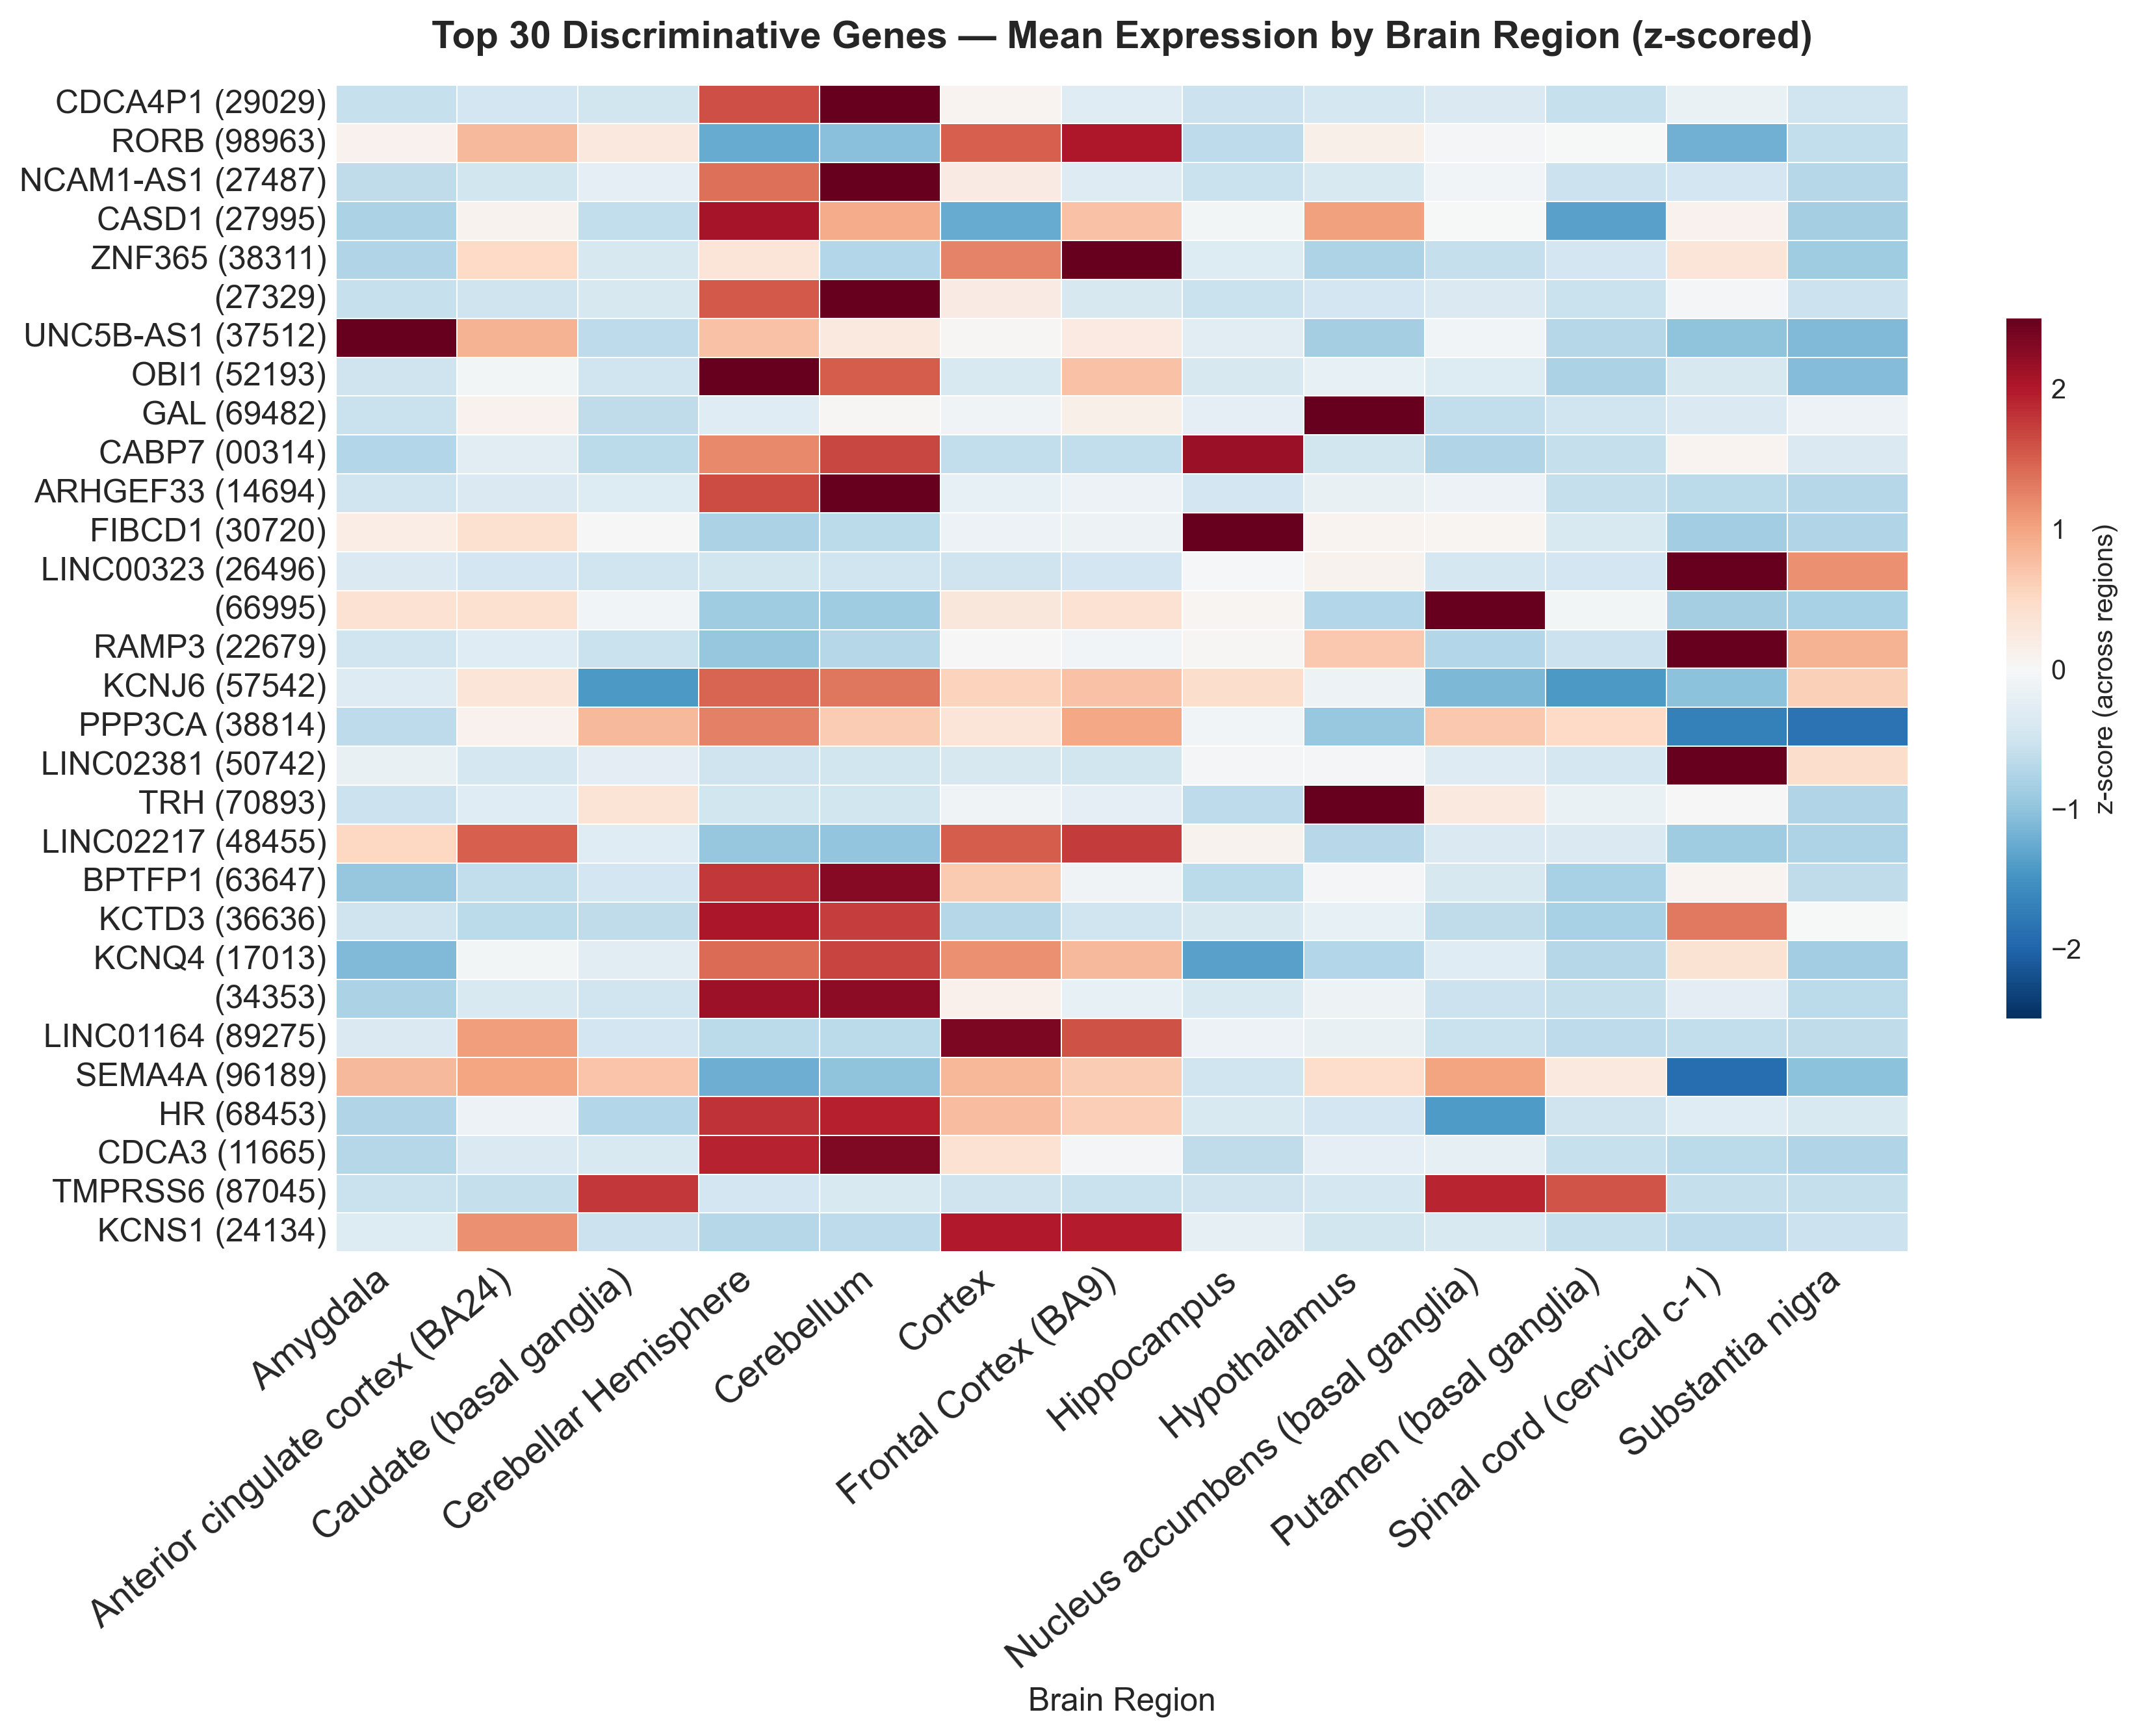
Box plots for individual marker genes match expectations. GAL and TRH are highest in the hypothalamus, RORB in cortical regions, KCNJ6 in cerebellum and substantia nigra:
Caveats
The pseudogene at rank #1 (CDCA4P1) is the result I’m least confident about. It could be genuine regulatory transcription, or it could be a mapping artefact. Feature importance here tracks what XGBoost deems as more important for classification, not differential expression magnitude, so a gene can rank high without being highly differentially expressed if it happens to be informative at decision boundaries.
GTEx bulk RNA-seq also averages across all cell types in each tissue block. Single-cell or spatial transcriptomics would clarify which cell populations actually drive each marker’s region specificity. And Random Forest underperformed (90.2%), probably because I didn’t tune its hyperparameters. With proper tuning it would likely close the gap.
Conclusion
XGBoost gets 95.1% accuracy at predicting brain region from bulk gene expression across 13 GTEx regions. The accuracy is fine, but I care more about the feature ranking. The top genes aren’t mysterious: hypothalamic neuropeptides, cerebellar cell-type markers, cortical layer transcription factors, region-specific ion channels. Non-coding RNAs make up ~37% of the top 30, which fits with the brain’s unusually complex non-coding transcriptome.
Logistic Regression reaching 93.4% is maybe the most telling result. Brain regions are already well-separated in expression space. The hard part isn’t model complexity. It’s the biology at the boundaries, especially among basal ganglia subregions that share developmental origins and cell types.