Exploratory analysis of Medicare drug cost data 2011-2015
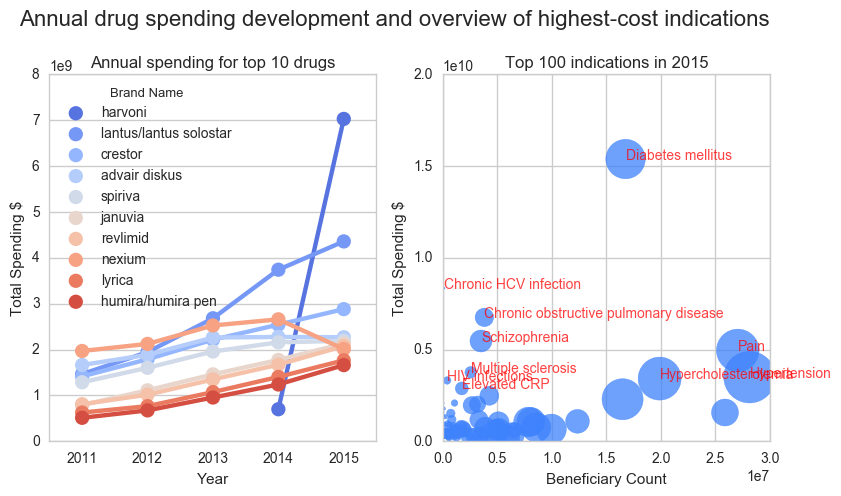
Health care systems world-wide are under pressure due to the high costs associated with disease. Now more than ever, particularly in developed countries, we have access to the latest advancements in medicine. This contrasts with the challenge of making those treatments available to as many patients as possible. It is imperative to find ways maximize the positive impact on the quality of life of patients, while maintaining a sustainable health care system. For this purpose I performed an analysis of Medicare data in the USA. Furthermore I used a drug-disease open database to cluster the costs by disease. I identified the most expensive diseases (mostly chronic diseases such as Diabetes) and the most expensive medicines. A drug for the treatment of HCV infections (Harvoni) stands out with the highest total costs in 2015. After this first exploration, I propose the in-depth analysis of further data to enable more targeted conclusions and recommendations to improve health care, such as linking of price databases to compare drug costs for the similar indications or the analysis of population data registers that document life style characteristics of healthy and sick individuals to identify those at risk of developing high-cost diseases. ...